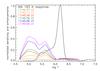
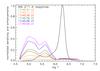
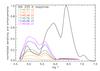
Fig. 6
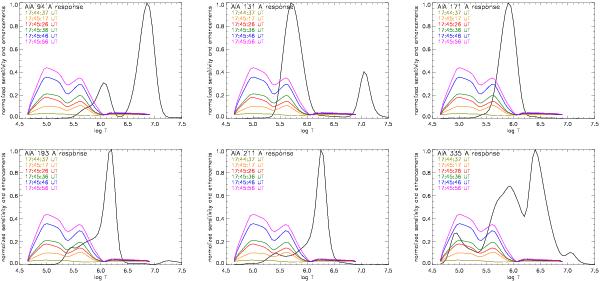
Nominal, normalized AIA temperature response functions (Boerner et al. 2011), with CDS enhancement factors (normalized to the largest value which occurs for Fe XIX, then multiplied by 10 to improve visibility in these frames) for six of the first ten CDS exposures, beginning with the first exposure during the first precursor and ending with the first peak during the first precursor of the M2.3 flare. The interval between exposures is 9.8 s. The majority of the intensity enhancements occur at temperatures less than log T = 5.8, with the largest values at log T = 5.0 (for the last four CDS exposures in this series). The greatest contributions to AIA’s brightenings occur where the product of the intensity enhancements and the response functions are largest.
Current usage metrics show cumulative count of Article Views (full-text article views including HTML views, PDF and ePub downloads, according to the available data) and Abstracts Views on Vision4Press platform.
Data correspond to usage on the plateform after 2015. The current usage metrics is available 48-96 hours after online publication and is updated daily on week days.
Initial download of the metrics may take a while.