Fig. 5
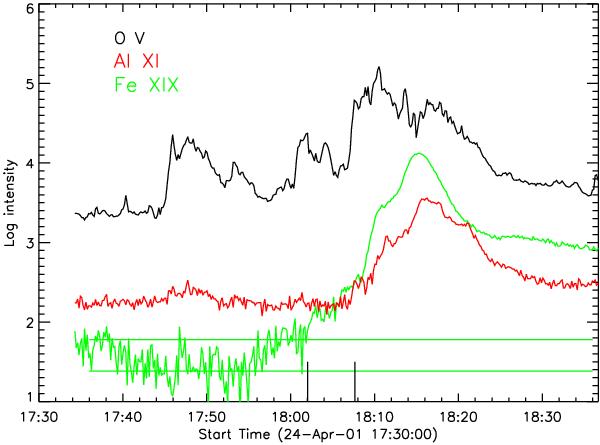
Light curves of O V 629.7 Å, Al XI 550.0 Å, and Fe XIX 592.2 Å obtained with SOHO’s CDS in rapid cadence (9.8 s) stare mode during the 2001 April 24 GOES M2.3 flare reported by Brosius & Phillips (2004). We use these and light curves from six additional spectral lines to measure average preflare intensities and flare intensity enhancement factors as described in the text. Solid horizontal lines indicate ±1σ from the average pre-flare Fe XIX noise. The long vertical tick mark at 18:02:00 UT indicates the time at which the Fe XIX intensity exceeds and remains continuously greater than its pre-flare noise level by more than 1σ, and the long vertical tick mark at 18:07:40 UT indicates the time at which Yohkoh hard X-ray count rates became statistically significant (with a peak at 18:10:40 UT).
Current usage metrics show cumulative count of Article Views (full-text article views including HTML views, PDF and ePub downloads, according to the available data) and Abstracts Views on Vision4Press platform.
Data correspond to usage on the plateform after 2015. The current usage metrics is available 48-96 hours after online publication and is updated daily on week days.
Initial download of the metrics may take a while.