Fig. 3
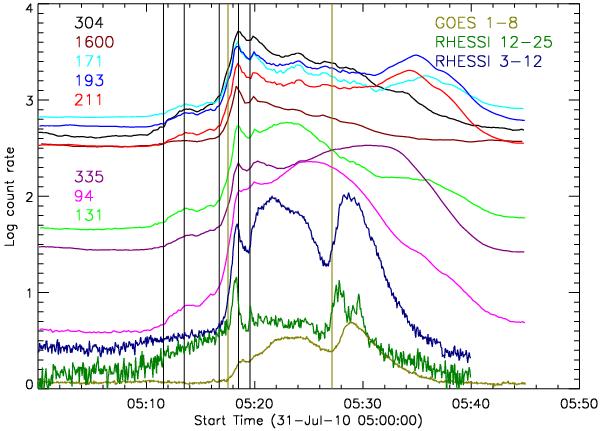
Light curves (log of the count rate for AIA, arbitrary units for GOES, log of the count rate for RHESSI, but shifted downward by 2.2 for the 3–12 keV light curve, and 1.65 for the 12–25 keV light curve) from eight wavelength channels on AIA averaged over area A (see Fig. 1) in which the brightening first occurred during the B4.8 microflare on July 31. Solid vertical lines indicate the start of an increase in EUV emission observed by AIA no later than 05:11:34 UT, a peak in the early (precursor?) brightening at 05:13:30 UT, the start of an impulsive rise in AIA emission at 05:16:44 UT, the start of the first burst recorded by GOES at 05:17:32 UT, the first impulsive peak detected by AIA at 05:18:30 UT (simultaneously for all wavebands, within the uncertainty of the cadence), the rise toward a secondary peak at 05:19:34 UT, and the start of the second burst recorded by GOES at 05:27:08 UT.
Current usage metrics show cumulative count of Article Views (full-text article views including HTML views, PDF and ePub downloads, according to the available data) and Abstracts Views on Vision4Press platform.
Data correspond to usage on the plateform after 2015. The current usage metrics is available 48-96 hours after online publication and is updated daily on week days.
Initial download of the metrics may take a while.