Fig. 1
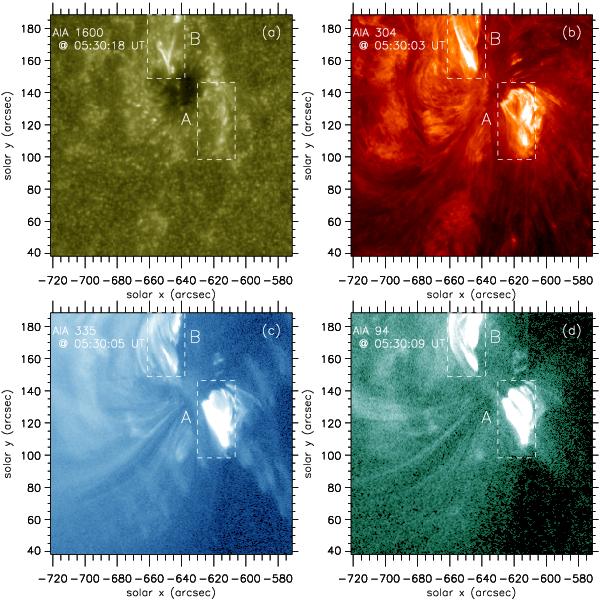
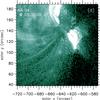
 AIA images of AR 11092 in a)
the 1600 Å channel at 05:30:18 UT, b) the 304 Å channel at
05:30:03 UT, c) the 335 Å channel at 05:30:05 UT, and d) the
94 Å channel at 05:30:09 UT on 2010 July 31. The dashed rectangles labeled “A” and “B”
outline areas within which successive bursts were observed with AIA (first in A, later
in B) and RHESSI during the GOES B4.8 microflare, and for which we derived the
spatially averaged AIA light curves shown in Figs. 3 and 4. Temporal evolution in the 304
and 94 Å channels can be seen in the movie available online.
AIA images of AR 11092 in a)
the 1600 Å channel at 05:30:18 UT, b) the 304 Å channel at
05:30:03 UT, c) the 335 Å channel at 05:30:05 UT, and d) the
94 Å channel at 05:30:09 UT on 2010 July 31. The dashed rectangles labeled “A” and “B”
outline areas within which successive bursts were observed with AIA (first in A, later
in B) and RHESSI during the GOES B4.8 microflare, and for which we derived the
spatially averaged AIA light curves shown in Figs. 3 and 4. Temporal evolution in the 304
and 94 Å channels can be seen in the movie available online.
Current usage metrics show cumulative count of Article Views (full-text article views including HTML views, PDF and ePub downloads, according to the available data) and Abstracts Views on Vision4Press platform.
Data correspond to usage on the plateform after 2015. The current usage metrics is available 48-96 hours after online publication and is updated daily on week days.
Initial download of the metrics may take a while.