Fig. 3
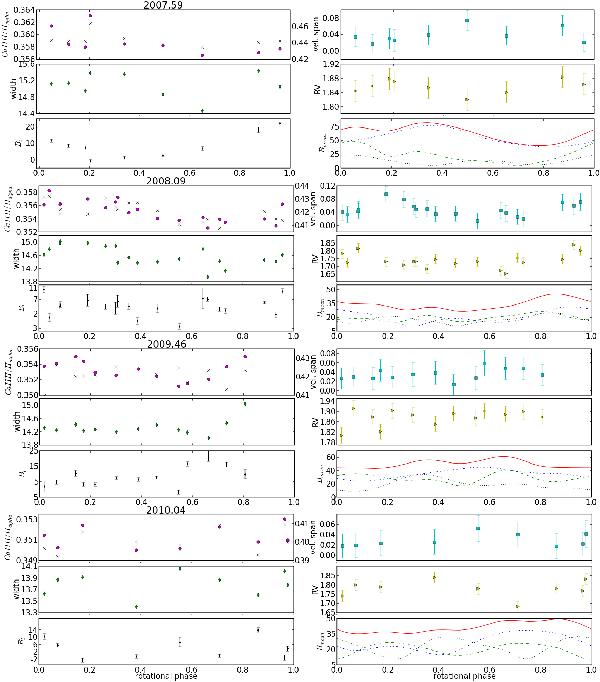
Four sets of six subplots, each set corresponding to one epoch (from top to bottom, 2007.59, 2008.09, 2009.46, and 2010.04). For each set, the left subplots contain, from top to bottom, the NHα-index (filled circles and left axis) and NCaIIH-index (crosses and right axis of the top panel of each set), the FeI@846.8404 magnetic line widths (km s-1), Bl (Gauss). The right subplots, from top to bottom, correspond to the velocity spans (km s-1) obtained from the profile bisectors (Sect. 4.2), the radial velocity (km s-1), and the mean unsigned magnetic strength of the total (full line), radial (dashes), azimuthal (dot-dashes) and meridional (dots) magnetic field components extract from the ZDI maps. Error bars are not included whenever they are smaller than the symbol size.
Current usage metrics show cumulative count of Article Views (full-text article views including HTML views, PDF and ePub downloads, according to the available data) and Abstracts Views on Vision4Press platform.
Data correspond to usage on the plateform after 2015. The current usage metrics is available 48-96 hours after online publication and is updated daily on week days.
Initial download of the metrics may take a while.