Free Access
Fig. 4
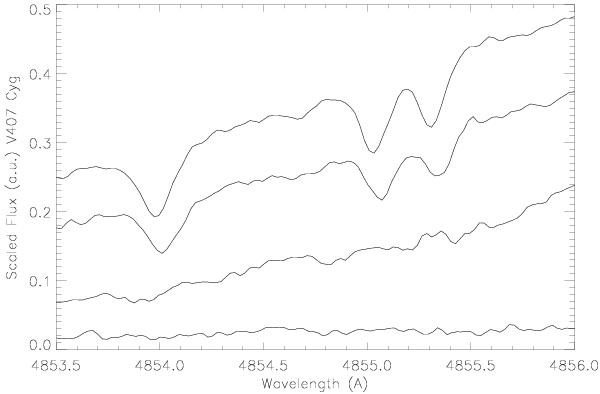
Development of the absorption lines in the blue wing of Hβ emission line profile, Y II 4854.87, Ti II 4855.91, and Cr II 4856.86 Å, during the early stages of the outburst. From top to bottom, the sequence is JD 55 286, 55 288, 55 314, and 55 334 (see text and Table 3 for details).
Current usage metrics show cumulative count of Article Views (full-text article views including HTML views, PDF and ePub downloads, according to the available data) and Abstracts Views on Vision4Press platform.
Data correspond to usage on the plateform after 2015. The current usage metrics is available 48-96 hours after online publication and is updated daily on week days.
Initial download of the metrics may take a while.