Fig. 9
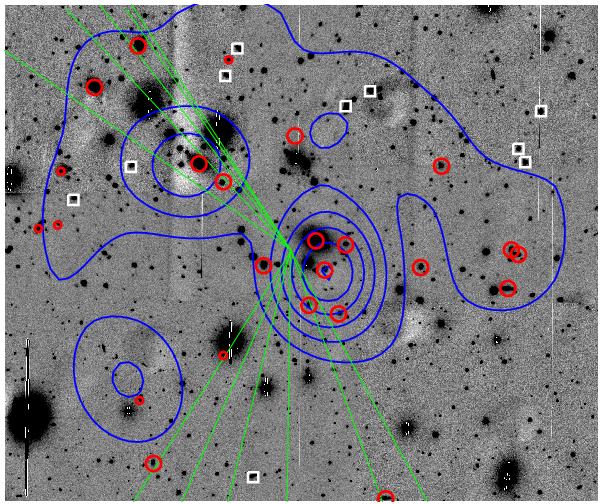
Adaptative kernel galaxy density map of galaxies with photometric redshifts lower than 0.095 along the NGC 6034 line of sight (blue contours). The first contour corresponds to the mean galaxy density value over the field of view, and the last contour to the maximal value. The size of the image is 20 × 20 arcmin2. North is up and east is to the left. Red circles are galaxies with a spectroscopic redshift inside the group (small and large circles are galaxies with mean stellar population younger and older than 1010 yr). White squares are galaxies with spectroscopic redshift outside the group. Green lines represent the directions to the closest galaxy clusters (see Lopes de Oliveira et al. 2010).
Current usage metrics show cumulative count of Article Views (full-text article views including HTML views, PDF and ePub downloads, according to the available data) and Abstracts Views on Vision4Press platform.
Data correspond to usage on the plateform after 2015. The current usage metrics is available 48-96 hours after online publication and is updated daily on week days.
Initial download of the metrics may take a while.