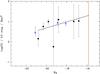
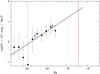
Fig. 15
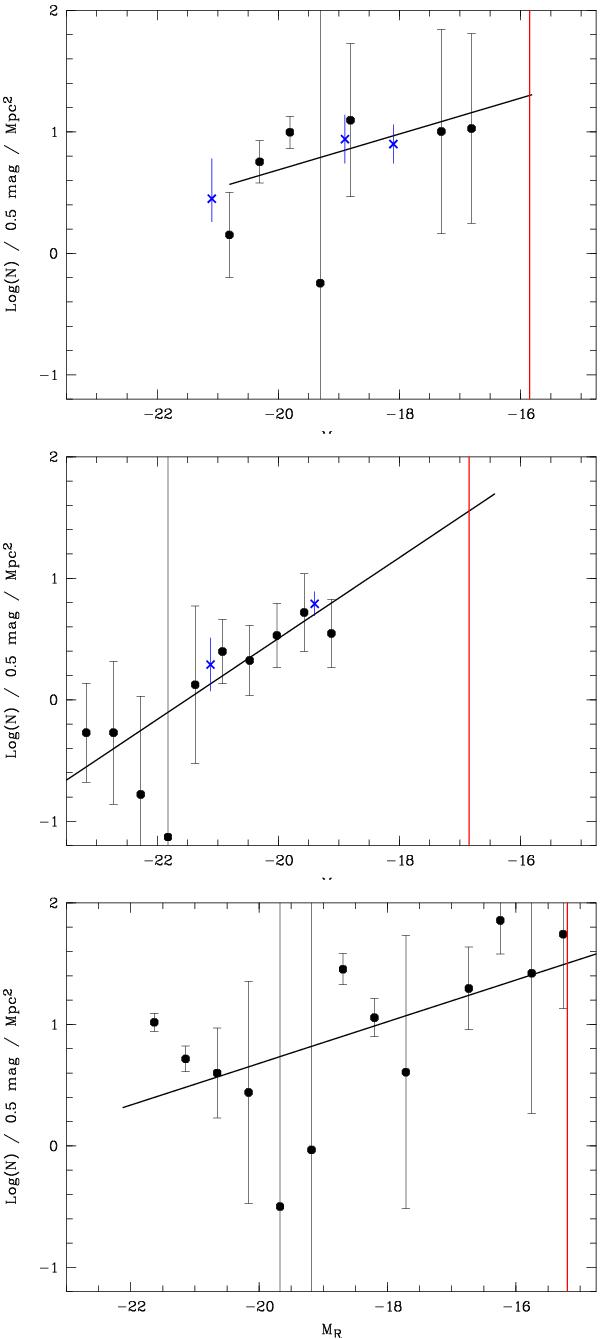
Statistically-subtracted Rc-band galaxy luminosity functions of NGC 6034 (top), 1RXS J235814.4+150524 (middle), and RX J1119.7+2126 (bottom). The black lines show the mean luminosity functions in the MRc intervals [–21, –18.] (NGC 6034) and [–22., –19.] (1RXS J235814.4+150524). The red lines are the adopted completeness levels. The blue crosses are from the spectroscopic catalogs.
Current usage metrics show cumulative count of Article Views (full-text article views including HTML views, PDF and ePub downloads, according to the available data) and Abstracts Views on Vision4Press platform.
Data correspond to usage on the plateform after 2015. The current usage metrics is available 48-96 hours after online publication and is updated daily on week days.
Initial download of the metrics may take a while.