Fig. 11
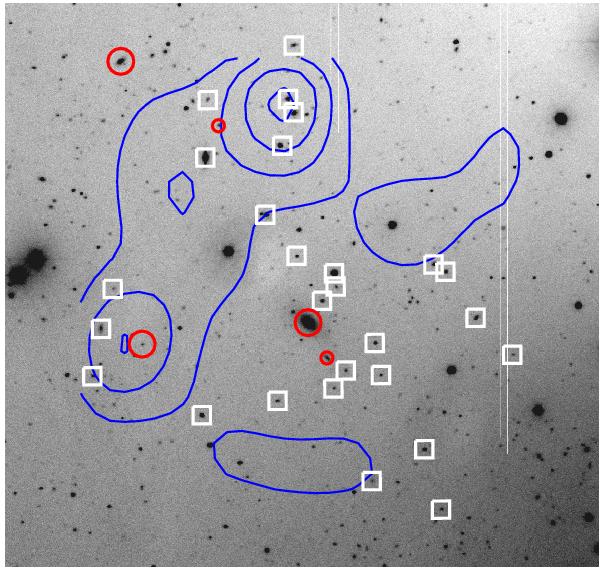
Adaptative kernel galaxy density map of galaxies with photometric redshifts in the [0., 0.1] redshift interval along the RX J1119.7+2126 line of sight (blue contours). The first contour corresponds to the mean galaxy density value over the field of view, and the last contour to the maximal value. The size of the image is 11.5 × 11.5 arcmin2. North is up and east is to the left. Symbols are the same as in Fig. 9. The fossil group main galaxy is at the image center.
Current usage metrics show cumulative count of Article Views (full-text article views including HTML views, PDF and ePub downloads, according to the available data) and Abstracts Views on Vision4Press platform.
Data correspond to usage on the plateform after 2015. The current usage metrics is available 48-96 hours after online publication and is updated daily on week days.
Initial download of the metrics may take a while.