Fig. 3
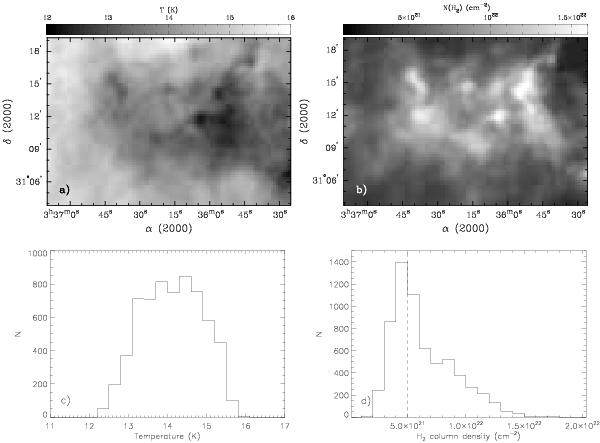
SED-fitting results for B1-E. Top panels shows the temperature a) and H2 column density b) maps across B1-E as measured from SED-fitting to 160–500 μm data, according to Eqs. (1) and (2) and assuming β = 2. Bottom panels show the histograms of the above maps. The temperature histogram c) uses a bin size of 0.3 K and the H2 column density histogram d) uses a bin size of 1 × 1021 cm-2. For comparison, the dashed line in panel d) indicates the observed column density threshold (from extinction) for core formation from Kirk et al. (2006).
Current usage metrics show cumulative count of Article Views (full-text article views including HTML views, PDF and ePub downloads, according to the available data) and Abstracts Views on Vision4Press platform.
Data correspond to usage on the plateform after 2015. The current usage metrics is available 48-96 hours after online publication and is updated daily on week days.
Initial download of the metrics may take a while.