Fig. 2
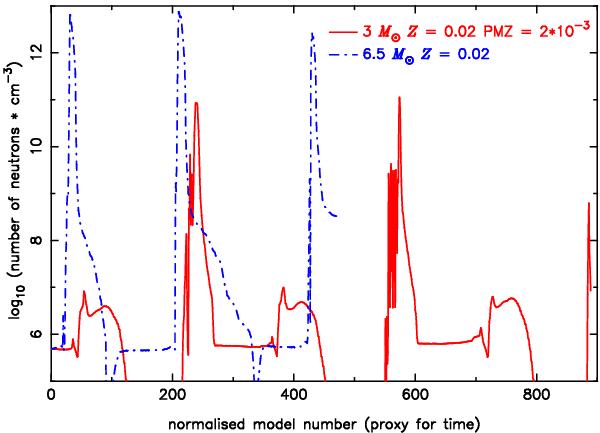
Maximum neutron density in the He intershell versus normalised model number (proxy for time) showing the last three TPs computed for a 3 M⊙ AGB star with a PMZ of 2 × 10⁻³ M⊙ (red curve) and a 6.5 M⊙ model without a PMZ included (blue curve). The peaks are a result of the 22Ne(α,n)25Mg reaction activated during TPs. For the 3 M⊙ model the neutron flux during each TPs lasts for ~4 yr and the total time-integrated neutron flux (neutron exposure τ) is ~0.02 mbarn-1. In the 6.5 M⊙ model the neutron density reaches 109 cm-3 for ~ 3 yr and τ ~ 0.2 mbarn-1. The secondary bumps at ~107 cm-3 in the 3 M⊙ model are a result of the 13C(α,n)16O reaction, which is activated during the interpulse phase due to the PMZ. This activation lasts for ~30 000 yr and results in τ ~ 0.4 mbarn-1 (see also Lugaro et al. 2003). The plateaux at ~106 cm-3 represent neutrons released during radiative shell He burning in the interpulse periods. These neutron fluxes are insignificant compared to the others (with τ < 0.02 mbarn-1). Furthermore, the material affected does not make it to the stellar surface as it remains buried in the C–O core. (This figure is available in color in the electronic form.)
Current usage metrics show cumulative count of Article Views (full-text article views including HTML views, PDF and ePub downloads, according to the available data) and Abstracts Views on Vision4Press platform.
Data correspond to usage on the plateform after 2015. The current usage metrics is available 48-96 hours after online publication and is updated daily on week days.
Initial download of the metrics may take a while.