Fig. 4
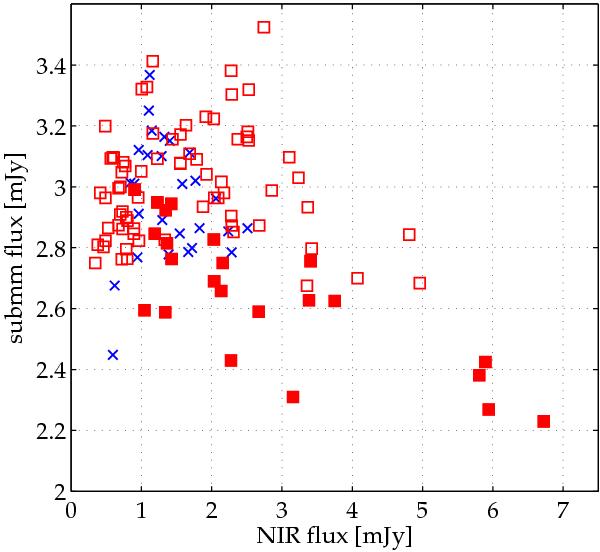
Comparison of simultaneous NIR and sub-mm fluxes for the July 2007 campaign. The graph shows the sub-mm vs. Ks-band (red squares) or L-band (blue crosses) NIR flux. The July 20 night data are marked as filled-in red squares. The NIR fluxes were binned to the sampling of the sub-mm lightcurve (5.6 min). The Ks-band scatterplots shows a significant anticorrelation of r ≈ − 0.5, with p-value p = 6.0 × 10⁻⁶.
Current usage metrics show cumulative count of Article Views (full-text article views including HTML views, PDF and ePub downloads, according to the available data) and Abstracts Views on Vision4Press platform.
Data correspond to usage on the plateform after 2015. The current usage metrics is available 48-96 hours after online publication and is updated daily on week days.
Initial download of the metrics may take a while.