| Issue |
A&A
Volume 540, April 2012
|
|
|---|---|---|
| Article Number | A91 | |
| Number of page(s) | 9 | |
| Section | Stellar structure and evolution | |
| DOI | https://doi.org/10.1051/0004-6361/201117715 | |
| Published online | 03 April 2012 | |
The spectroscopic orbits and physical parameters of GG Carinae⋆
1 Facultad de Ciencias Astronómicas y Geofísicas, Universidad Nacional de La Plata, Paseo del Bosque S/N – 1900 La Plata, Buenos Aires, Argentina
e-mail: This email address is being protected from spambots. You need JavaScript enabled to view it.
2 Instituto de Astrofísica de La Plata (CCT La Plata-CONICET-UNLP), Argentina
3 Comisión de Investigaciones Científicas de la Provincia de Buenos Aires, (CIC), Argentina
4 Consejo Nacional de Investigaciones Científicas y Técnicas, (CONICET), Argentina
Received: 15 July 2011
Accepted: 22 December 2011
Abstract
Aims. GG Car is an eclipsing binary classified as a B[e] supergiant star. The aims of our study are to improve the orbital elements of the binary system in order to obtain the actual orbital period of this system. We also compare the spectral energy distribution of the observed fluxes over a wide wavelength range with a model of a circumstellar envelope composed of gas and dust. This fitting allows us to derive the physical parameters of the system and its environment, as well as to obtain an estimation of the distance to GG Car.
Methods. We analyzed about 55 optical and near infrared spectrograms taken during 1996–2010. The spectroscopic orbits were obtained by measuring the radial velocities of the blueshifted absorptions of the He I P-Cygni profiles, which are very representative of the orbital motion of both stars. On the other hand, we modeled the spectral energy distribution of GG Car, proposing a simple model of a spherical envelope consisting of a layer close to the central star composed of ionized gas and other outermost layers composed of dust. Its effect on the spectral energy distribution considering a central B-type star is presented. Comparing the model with the observed continuum energy distribution of GG Car, we can derive fundamental parameters of the system, as well as global physical properties of the gas and dust envelope. It is also possible to estimate the distance taking the spectral regions into account where the theoretical data fit the observational data very well and using the set of parameters obtained and the value of the observed flux for different wavelengths.
Results. For the first time, we have determined the orbits for both components of the binary through a detailed study of the He I lines, at λλ4471, 5875, 6678, and 7065 Å, thereby obtaining an orbital period of 31.033 days. An eccentric orbit with e = 0.28 and a mass ratio q = 2.2 ± 0.9 were calculated. Comparing the model with the observed continuum energy distribution of GG Car, we obtain Teff = 23 000 K and log g = 3. The central star is surrounded by a spherical envelope consisting of a layer of 3.5 stellar radii composed of ionized gas and other outermost dust layers with EB − V = 0.39. These calculations are not strongly modified if we consider two similar B-type stars instead of a central star, provided our model suggests that the second star might contribute less than 10% of the primary flux. The calculated effective temperature is consistent with an spectral type B0-B2 and a distance to the object of 5 ± 1 kpc was determined.
Key words: techniques: spectroscopic / binaries: eclipsing / stars: individual: GG Car / stars: emission-line, Be
Based on observations taken at Complejo Astronómico EL LEONCITO, operated under agreement between the Consejo Nacional de Investigaciones Científicas y Técnicas de la República Argentina and the National Universities of La Plata, Córdoba, and San Juan.
© ESO, 2012
1. Introduction
GG Car was classified by Lamers et al. (1998) as a galactic B[e] supergiant star based on estimates of effective temperature and luminosity. It includes characteristics of the B[e] phenomenon, e.g., Balmer lines with strong P Cygni profiles, low excitation permitted and forbidden emission lines (mainly Fe II, [Fe II] and [O I]), and strong infrared excess due to hot circumstellar dust. Recently, the AMBER spectrum of GG Car seems to display clearly detectable 13CO band emission, supporting GG Car as a B[e] supergiant star. However, Kraus (2009) finds that the 12C/13C isotope ratio is lower than the expected value within the suspected evolutionary phase of GG Car according to nonrotating and rotating stellar evolution models. This discrepancy might indicate that the luminosity or the rotation considered for the star could be understimated.
Considering GG Car as a binary, Hernández et al. (1981) (hereafter HLST81) were the first to obtain the orbital period of 31.030 days for the system, deduced from the radial velocity of the P Cygni hydrogen absorptions. Later, Fourier analysis of light variations of an extensive set of photoelectric photometry carried out by Gosset et al. (1984) led to a redetermination of the period. These authors found two plausible values, 31.020 and 62.039 days, but on the basis of the radial velocity behavior along the light curve, a higher priority was given to a 31-day period by Gosset et al. (1985) (hereafter GHSS85). In both spectroscopic studies (HLST81 and GHSS85), the obtained radial velocity curves presented a noticeable dispersion in the observed data.
The light curve shows two minima that are different in width. The Balmer lines exibit P Cygni profiles during the whole light curve, and according to GHSS85, both a second absorption component in the hydrogen lines and pure absorption lines due to HeI, not reported previously, appear around the secondary minimum or “glitch” (phase ~ 0.45) in the light curve. Brandi et al. (1987) observed that, although the number of data was fairly scarce, the UV light curve is very similar to the optical one, and it appears that the secondary minimum is definitely more pronounced in the ultraviolet than in the long wavelengths.
GG Car is an intrinsicaly polarized object. Klare & Neckel (1977) and Barbier & Swings (1982) reported optical broadband polarization. Then, Gnedin et al. (1992) detected optical polarization variability. Pereyra et al. (2009) performed Hα spectropolarimetry of GG Car. The depolarization line effect is evident in the Q − U diagram for two observed epochs, confirming that light from the system is intrinsically polarized, and a rotation of the polarization angle, PA, along Hα indicated a counterclockwise rotation disk with a clearly defined axis of symmetry. From the modeling of visibilities obtained from VLTI/MIDI, the presence of a dusty disk seems to be confirmed in GG Car (Borges-Fernandes 2010).
We intend to achieve some progress in the understanding of GG Car, which remains an enigmatic object. The aim of this paper is to analyze a new series of optical middle-resolution spectra in an attempt to derive constraints on a qualitative physical model of this peculiar object and its environment in terms of a binary system. Section 2 describes our observations. Section 3 includes the determination of the spectroscopic orbits for both components of the system and a decription of the key features of the optical spectrum. Section 4 shows interstellar-extinction and distance determination. Section 5 displays the fitting of the spectral energy distribution based on a model with gas and dust circumstellar components adopted to obtain the physical parameters of the star and its environment. Our discussion and conclusions appear in Sects. 6 and 7, respectively.
2. Observations
The spectroscopic observations were carried out with the 2.15 m Jorge Sahade telescope at the Complejo Astronómico EL LEONCITO (CASLEO), San Juan, Argentina. The REOSC echelle spectrograph was used at a mean resolution of 12000, and the spectra were recorded with a Tek CCD (1024 × 1024 pixels) detector. The log of the observations covering fourteen years (1996–2010) is shown in Table 1. The wavelength calibration was performed by using the Th-Ar lamps with reference exposure at the same sky position. The echelle spectra were reduced with the standard IRAF packages, CCDRED and ECHELLE. To obtain the flux calibration, standard stars from Hamuy et al. (1992) and Hamuy et al. (1994) were observed each night. A comparison of the spectra of the standards suggests that the flux calibration errors are about 20% in the central part of each echelle order.
Spectroscopic observations of GG Car and the mean radial velocities of He I λλ4471, 5875, 6678, and 7065 absorption lines for both components of the binary.
Orbital solutions of GG Car obtained from the HeI absorption lines λλ4471, 5875, 6678, and 7065 Å.
3. Spectral analysis
3.1. Spectroscopic orbits
The variable He I lines profiles have shown that several absorption components superimposed on a broad emission could be considered as photospheric lines. We have been aware that the B[e] stars are embedded in a dense circumstellar material polluting the photospheric lines significantly. However, the result of our radial velocity analysis led us to verify that those absorption components – probably blended with the blueshifted absorption of the P-Cygni profile – originate in both stars of the binary system. Our task was to measure the radial velocities of those components of the He I lines at λλ4471, 5875, 6678, and 7065 Å by Gaussian fitting, provided that the observed spectral range allowed it. We found that they are representative of the orbital motion of both stars. As a sample, Fig. 1 shows the variations of the profiles for He I λ5875 along the orbital phases. Table 1 presents the mean heliocentric radial velocities calculated for each spectrum, together with the standard deviation and the number of measured lines. The radial velocity curves are presented in Fig. 2 and the orbital elements obtained for the combined solutions in Table 2. Continuous curves in the figure represent the best fit with P = 31.033 ± 0.008 days and e = 0.28 ± 0.06. Columns 6 and 8 in Table 1 show the deviations (O–C) around the best combined solution obtained. The velocity curve of the primary component shows larger residuals just before the eclipse producing a distortion in the curve. Effects of cycle-to cycle changes were descarded, but other mechanisms (rotation, gas streams, tidal effects, etc.) could be the origin of velocity-curve distortions. The projected binary separation is Asin i = 0.57 AU, and the individual masses are MPrsin3i = 18 ± 3 M⊙ and MSecsin3i = 8 ± 2 M⊙, resulting in a mass ratio of q = MPr/MSec = 2.2 ± 0.9.
 |
Fig. 1 Variations in the He I λ5875 profile along the orbital phases. Several blueshifted absorption components superimposed on a broad emission are observed. |
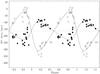 |
Fig. 2 Fill circle: primary component. Empty circle: secondary component. Continuous curve: the best fit of the orbital solutions. |
3.2. The line spectrum
On the basis of the IUE data, Brandi et al. (1987) reported that GG Car presents a large number of ionization stages. The absorption line widths increase with the ionization stage, and the highly ionized resonance absorption lines of C IV and Si IV show the highest expansion velocities (~−168 km s-1). These authors have also indicated that some correlation exists between the expansion velocities and the ionization potentials. One explanation could be that the degree of ionization increases outwards in an accelerating stellar wind. On the other hand, the optical spectrum of GG Car is dominated, as is known, by H I and Fe II emission lines. The emission lines seen in our spectra can basically be divided into four groups: Beals’ type III P-Cygni profiles, canonical P-Cygni profiles, double-peaked emissions with a weak central absorption, and single-peaked emission lines. The behavior of the different elements during the time of our observations can be summarized as follows.
-
Hydrogen: the Balmer members in our data, Hα, Hβ, Hγ, and Hδ show Beals’ type III P-Cygni profiles with a strong and broad red emission component over the full orbital cycle and a central absorption reaching, in most cases, below the continuum. The profiles of three of them, Hα, Hβ, and Hγ, can be seen in Fig. 3 (left panel). The peak separation is practically constant, ~−220 km s-1. The radial velocities of the central absorption seem to increase with the Balmer number n, as reported by GHSS85. Besides that, we observe temporal changes in the radial velocities, which seem to be related to the orbital cycles rather than to the orbital phases. As shown in Fig. 3 (right panel), this effect is stronger in Hα, since it is practically not detected in the other Balmer members. Hα presents broad and symmetric wings, with full width at zero intensity (FWZI) reaching ~1000 km s-1, as seen in Fig. 4. Along the orbital phases, two peaks are always present, where the red peak stronger than the blue one. A weakening in the total emission of Hα is observed at the times of both quadratures (phases 0.15 and 0.87).
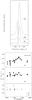
Fig. 3 Left panel: Beals’ type III PCygni profiles in the Balmer lines. The radial velocities of the central absorptions are almost constant, but in Hα they show temporal changes in the velocities, which seem to be related to the orbital cycles rather than to the orbital phases (right panels).
In our spectra of May 2004 (phase ~ 0.7) and April 2005 (phase ~ 0.0), we identify the Paschen lines P25 to P19 and P16 to P13 in separated apertures. They are narrow emission lines and display double-peaked profiles with a separation of ~36 km s-1. The red peak is stronger than the blue one, as also observed in the Balmer members, and the width of the emission shows a slight variation between both phases, an FWHM ~ 260 km s-1 in May 2004 and ~235 km s-1 in April 2005. The P13 line profile is shown in Fig. 4.
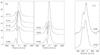
Fig. 4 H I profiles along the orbital phases. Two peaks are always observed, with the red peak stronger than the blue one. Left: Hα profiles. A weakening in the emission is produced at phases 0.15 and 0.87. Right: P13 profiles of the Paschen Series.
-
He I: it is worth emphasizing the variability of the He I lines in GG Car, since they had never been reported in the earlier published papers, until GHSS85 indicated the presence of He I λλ4471, 4026, and 3965 in their spectra, but only in absorption and appearing at certain phases. In our spectra, the He I lines are observed along all the orbital phases as P-Cygni profiles with a blueshifted absorption at ~-100 km s-1, and other several absorption components superimposed on the broad emission are also observed (see Fig. 1). The detailed radial velocity analysis presented in the previous section led us to point out that those absorption components are photospheric lines originating in both stars of the binary system.
-
Fe II: a very complex Fe II spectrum is observed in GG Car. In high-resolution IUE spectra Brandi et al. (1987) indicated strong Fe II absorption features in the far UV, except for the multiplet UV191, which shows P-Cygni profiles. Toward the long wavelengths, the Fe II lines begin to develop emissions. In the optical region, different kinds of emission profiles are observed (Fig. 6). Most of the Fe II lines show broad and structured profiles, sometimes double-peaked emissions separated by ~100 km s-1. The same figure shows the twin emission peaks in the line Fe II λ6432 (multiplet 40) with the blue peak stronger than the red one at phases 0.00 to 0.24, but the reverse occurs at phases 0.58 to 0.82. Other lines, such as Fe II λ6456 (multiplet 74), suffer a sort of transition along the phases from a double-peaked emission to a P-Cygni profile. On the other hand, the members of multiplet 42 show Beals’s type III P Cyg profiles similar to those of the Balmer lines (see Fig. 5, left panel). We can see in the figure that the Fe II line at λ5018 Å presents two blueshifted absorptions, but one of them is associated to He I at λ5015.675 Å. In the right panel, variations of the Fe II λ4923 line with the orbital phases are shown. Several blueshifted absorption components are present with a similar structure to He I λ5875.
-
O I: when the observed spectral range in our data is extended enough to the red wavelengths, the lines around λ7774 Å, which correspond to the permitted triplet of O I (see Fig. 7), can be analyzed. The observed profile, which is most likely a combination of emission and absorption components from each line of the triplet, suffers some changes at different phases, but a broad and strong emission with a sharp blueshifted absorption is always observed. Other weak, blueshifted absorption components are also present with variable radial velocities.
-
Na I: the doublet shows P-Cygni profiles with a weak and broad emission and two components in absorption (see Fig. 8), perfectly separated by ~110 km s-1. The stronger component very likely originated in the interstellar medium with radial velocities almost constant, +1.4 ± 3.6 and + 2.6 ± 3.4 km s-1 for λ5890 and λ5895, respectively. The more blueshifted absorption component is variable in both intensity and radial velocity. It is stronger and wider at phases ~ 0.6–0.8, and it seems to follow the orbital motion of the primary with a more positive systemic radial velocity, RV = −107.2 ± 11.4 and −106.0 ± 13.2 km s-1 for both components of the doublet, respectively. An important contribution from the circumstellar medium would be present in these lines. As it is seen in Fig. 8, other weak absorption components are clearly observed inmediately after the first quadrature (e.g. phases 0.25–0.45), and an additional absorption seems to be present on the blue wing of the line at the time of the second quadrature (phases ~ 0.8).
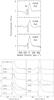
Fig. 5 Left panel: the Fe II lines members of multiplet 42 show PCygni profiles similar to those of the Balmer lines. Right panel: profile variations of one member of multiplet 42, Fe II λ4923, with the orbital phases.
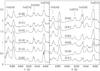
Fig. 6 Fe II emission lines in GG Car.
-
Other lines: the Si II multiplets 2, 4, and 5 are observed in emission. Mg II λ4481 is also observed in emission, but a contribution of Fe II λ4480.687 would be important.
-
Forbidden lines: our spectra display three [O I] lines at λλ5577, 6300, and 6363. The line λ5577 is a narrow emission with an almost constant radial velocity ~+2 ± 7 km s-1 and superimposed over a broad emission component. The unshifted and narrow emission is likely a telluric line with an auroral origin. The other two lines, λλ 6300 and 6363, which arise from the same upper level and originate in the same region, show similar profiles with a slight indication of a double-peaked emission. [Fe II]λλ4359, 4414; [Ca II] λ7291, 7324, and also [N II] λλ 5754, 6583 are observed, but as very weak emissions.
4. Interstellar extinction and distance
The extinction to GG Car can be determined using the following methods.
-
An empirical fit to the relation between E(B − V) and the equivalent widths of Na I D1 and K I λ7699 lines for single-lined absorption systems, given by Munari & Zwitter (1997), is used. As mentioned above, in our spectra the Na I doublet presents two perfectly separated components in absorption. One of them, stronger and sharp, is considered to have originated in the interstellar medium. Taking the mean equivalent width of the Na I D1 absorption, EW = 0.49 ± 0.04 we arrive at a value for E(B − V) = 0.30 ± 0.06. From the single absorption of K I λ7699, we obtain EW = 0.13 ± 0.04 and E(B − V) = 0.50 ± 0.16.
-
Another classic method of determining E(B − V) is used from the observed color index (B − V) = 0.552 ± 0.025 mag (Hipparcos Catalogue, ESA 1997) and the intrinsic color (Schmidt-Kaler 1982), (B − V)0 = −0.18 ± 0.01 mag corresponding to the spectral type B1-2Iab obtained for GG Car (see next section). In this case E(B − V) = 0.73 ± 0.04 is obtained.
From the IUE low-resolution data and assuming that the 2200 Å “bump” is of classical interstellar origin, Brandi et al. (1987) proposed an E(B − V) = 0.52 ± 0.0.
The different methods lead us to a mean extinction to GG Car of E(B − V) = 0.51 ± 0.15.
To derive the distance to GG Car, we use the mean value of V = 8.75 ± 0.25 mag from the light curve given by Gosset et al. (1984). Assuming the spectral type B1-2Iab, we consider MV = −6.3 ± 0.2 mag (Schmidt-Kaler 1982) and AV = 1.5 ± 0.45 for E(B − V) = 0.51 ± 0.15, resulting a distance D = 5 ± 2 Kpc. This value is two times greater than the distance determinated by Lopes et al. (1992) using the strength of Na I interstellar lines. In Sect. 5 we present another independent method for distance estimates.
5. Continuum energy distribution
5.1. Observational data
The optical spectra obtained at CASLEO are added to the rest of the photometric and spectroscopic data available in the literature to reproduce the continuum energy distribution of GG Car in a wide range of wavelengths. Figure 9 shows the observed continuum energy distribution, and Table 3 the data from IUE, CASLEO, ISO, 2MASS, and MSX used.
In the optical region we attach a low-resolution spectrum obtained at CASLEO on 2001 March 8 (provided by Dr. L. Cidale), where the Balmer jump is observed in emission. In the wavelength range 5600–8700 Å, we use one of our echelle high-resolution spectrum, and each aperture is treated separately. The data obtained at the JHK bands were derived by converting the 2MASS observed magnitudes into absolute fluxes through a spectral irradiance calibration process given by Cohen et al. (2003). For the Infrared Space Observatory (ISO) we obtained the ASCII text file from the full database processed as explained by Sloan et al. (2003). We also placed on this infrared spectrum the MSX points.
To fit the observed continuum we adopted the model developed by Zorec (1998) and Muratore et al. (2010), which is explained below.
5.2. The gas and dust envelope model
A simple model of an envelope made of gas and dust is presented to analyze its effect on the spectral energy distribution of a normal B star. By comparing the theoretical results with the observations, we can derive the fundamental parameters of the star, as well as the global physical properties of the gas and dust envelopes.
Zorec (1998) and Muratore et al. (2010) consider a B star surrounded by circumstellar material distributed in two different regions: a gaseous shell located close to the star at a few stellar radii, and a dust shell farther away at more than a hundred stellar radii. We took the B-type flux models from Kurucz (1979).
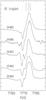 |
Fig. 7 Profiles of the permitted lines of the O I triplet and their variations with the phases. Vertical bars indicate the laboratory wavelengths for the triplet components. |
The proposed model of the gaseous circumstellar envelope is based on those presented by Cidale et al. (1989), Moujtahid (1998), and Moujtahid et al. (1999). Considering that the contribution of the envelope can be reduced to an equivalent shell, the emergent flux of a system formed by a star plus a spherical envelope can be calculated. Then a plane-parallel solution to the transfer equation can be adopted. The observed flux at the distance D obtained in this way is expressed as 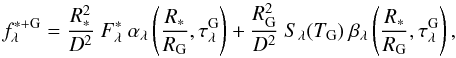 (1)where
  is the optical depth of the gaseous shell, R ∗ the stellar radius, RG the gaseous shell effective radius,
  the photospheric stellar flux, Sλ(TG) the source function, and TG the electron temperature of the gas. The factor αλ describes the attenuation of the star flux in the gas shell and the term Sλ βλ describes the emissivity of the gas. Both αλ and βλ are functions that can be numerically calculated.
Observational data for GG Car from the ultraviolet to the infrared.
Parameters obtained using a Kurucz’ model for Teff = 23 000 K, log g = 3 and a gaseous + dust envelope.
The circumstellar dust region is treated with the same scheme as proposed for the gaseous region. We characterized the absorption properties of the dust by a total optical depth  and the dust temperature TD. The expression for the observed flux at a distance D, for the star, the gaseous shell, the dust shell, and the interstellar medium is given by
 ![Mathematical equation: \begin{equation} f_{\lambda}^{\rm *+G+D+ISM} = \{f_{\lambda}^{\rm *+G} {\rm e}^{-\tau_{\lambda}^{\rm D}} + \frac {R_{\rm D}^{2}}{{D}^{2}}~ S_{\lambda} (T_{\rm D}) [1 - 2 E_{3}(2 \tau_{\lambda}^{\rm D})] \} {\rm e}^{-\tau_{\lambda}^{\rm ISM}}. \label{todo} \end{equation}](/articles/aa/full_html/2012/04/aa17715-11/aa17715-11-eq88.png) (2)The first term of Eq. (2) describes the attenuation of the system star + gaseous envelope due to the presence of a dust shell, and the second term,
(2)The first term of Eq. (2) describes the attenuation of the system star + gaseous envelope due to the presence of a dust shell, and the second term, ![Mathematical equation: \hbox{$S_{\lambda}(T_{\rm D}) [1 - 2 E_{3}(2 \tau_{\lambda}^{\rm D})]$}](/articles/aa/full_html/2012/04/aa17715-11/aa17715-11-eq89.png) , describes the flux emission of dust at a distance D. In an optically thin medium (τλ ≪ 1), the source function Sλ(TD) can be assumed constant inside the equivalent shell, and it can be demonstrated that the flux emission of dust tends to
, describes the flux emission of dust at a distance D. In an optically thin medium (τλ ≪ 1), the source function Sλ(TD) can be assumed constant inside the equivalent shell, and it can be demonstrated that the flux emission of dust tends to  . In this case, the dust emission will depend on the dust grain properties, which is described by the Cardelli et al. (1989) extinction law (see more details below). Instead, in an optically thick medium, this factor
 ![Mathematical equation: \hbox{$[1 - 2 E_{3}(2 \tau_{\lambda}^{\rm D})] \rightarrow 1$}](/articles/aa/full_html/2012/04/aa17715-11/aa17715-11-eq93.png) and the dust emission approachs the source function. Therefore the expression (2) represents the two extreme situations: optically thin and thick media.
and the dust emission approachs the source function. Therefore the expression (2) represents the two extreme situations: optically thin and thick media.
We applied this simple model to the ISO spectrum of GG Car, which is almost characterized by a linear function of wavelength with weak silicate emission or none at all, and also without PAHS (Voors 1999). It has been demonstrated by Bouwman et al. (2000) that in case when “no clear spectral signature, but only a broad continuous spectrum, is present, the relative contribution of the individual dust species produces predicted NIR fluxes which are indisttinguishable”. Therefore, in order to model the source function we roughly opted for a black body distribution, so the flux emission is represented by ![Mathematical equation: \hbox{$B_{\lambda}(T_D) [1 - 2 E_{3}(2 \tau_{\lambda}^{\rm D})]$}](/articles/aa/full_html/2012/04/aa17715-11/aa17715-11-eq94.png) . This approximation describes the global properties of this system, since it is not the main goal of this paper to analyze the detailed structure of the dust.
. This approximation describes the global properties of this system, since it is not the main goal of this paper to analyze the detailed structure of the dust.
In our simple model, both and  (the dust and the interstellar optical depths, respectively) are related to the extinction A(λ) through the expression τ = 0.4ln 10A(λ). For A(λ) we use the extinction law given by Cardelli et al. (1989): A(λ) = [RVa(1/λ) + b(1/λ)] E(B − V), where RV is the total to selective extinction and E(B − V) is the color excess. The standard value
  is adopted for the interstellar dust, whereas a different value of
  , greater than 3.1, is obtained for the circumstellar dust.
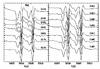 |
Fig. 8 Na I profiles in GG Car for different phases. Vertical bars indicate the laboratory wavelengths for each component of the doublet. |
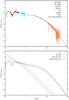 |
Fig. 9 Top: the observed energy distribution of GG Car and the theoretical model that considers a single central star with Teff = 23 000 K and log g = 3. Bottom: the individual components of the fitting. |
To eliminate the dependence on the distance D, we must normalize the flux to a reference wavelength λref. Using expression (2) we obtain the theoretical spectral energy distribution, from 0.1 to 100 μm, for different sets of the free parameters of our model: RG, TG, , RD, TD,  , ED(B − V), and EISM(B − V).
We have not made corrections for atmospheric extinction effects in our theoretical calculation. It is more appropriate to apply such corrections to the observational data, since they depend on the observatory itself. Moreover, in the case of the data obtained from satellite observations, it is not necessary to introduce the corrections.
5.3. Results
The best fitting was achieved with the parameters listed in Table 4. With these values we can conclude that our model, as expressed by Eq. (2), follows the case of an optically thin medium.
The continuous black line in Fig. 9 shows our best theoretical fitting corresponding to a model of a single central star with Teff = 23 000 ± 2000 K. Since the surface gravity is not sensitive to variations in continuum, we adopted log g = 3, which corresponds to a supergiant star. The spherical envelope consists of two regions: a layer close to the central star of 3.5 stellar radii composed of ionized gas, and other outermost layers composed of dust with EB − V = 0.3. A value of  was derived for the dust shell. For the interstellar medium, EB − V = 0.18 was added. The total extinction obtained here agrees very well with the E(B − V) calculated in Sect. 4.
It is possible to estimate the distance D writing the expression (2) as 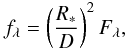 where Fλ is the output data, fλ the observed flux, and R⋆ = 32 ± 8 R⊙, the obtained stellar radius (see Sect. 6). Considering the regions where the theoretical data fit the observational data very well, we calculated the distance using the set of parameters obtained and the value of the observed flux for different wavelengths. Thus, we averaged a distance of 5 ± 1 kpc.
The results presented here are not significantly modified if we consider two B-type stars instead of a single central star. When assuming a mass of 8 M⊙ for the secondary star and taking a temperature similar to the primary star, our model suggests that the second star might contribute less than 10% of its fluxes.
Finally, considering the classification criteria adopted by Lopes et al. (1992) and Clark & Steele (2000), based on the emission features observed in the IR spectrum and the obtained effective temperature (23 000 K), together with the calibration temperature scale derived by Zorec et al. (2009), we conclude that the star is consistent with a B0-B2 spectral type.
6. Discussion
In our spectra the lowest Balmer lines display a PCygni profile of Beals’ type III with a violet-to-red ratio V/R < 1 (see Figs. 3 and 4). If we assume that this double-peaked appearance in the Balmer lines could be interpreted as coming from a Keplerian circumstellar disk, one would expect a velocity difference between both peaks increasing with the Balmer series, as the line-forming region is smaller because of the lower line opacity. However, the measured velocity differences are –225 km s-1 (Hα), –208 km s-1 (Hβ), –215 km s-1 (Hγ), and –220 km s-1 (Hδ). On the other hand, the radial velocities of the central absorptions are less negative than the upper members, indicating an envelope that is accelerated outwards and which is not consistent with what could be expected of a purely rotational velocity field. The central absorption could come from by self-absorption in a dense and slowly expanding wind or from a thick hydrogen neutral disk around the binary system, resulting in the well-known Balmer profiles observed in symbiotic stars. The high value of Hα/Hβ ~ 8 points to self-absorption as the most likely cause of the observed profiles.
Most of the emission lines in GG Car display double-peaked profiles, and the straightforward interpretation is that they originate in a disk of gas surrounding the system or in a disk situated at approximately 3.5 stellar radii from the primary component. The red and blue emission peaks correspond to the regions that are receding from us and moving toward us, respectively, and the central absorptions correspond to the gas along the line of sight with zero velocity.
The prominent emissions of Fe II lines, mainly members of multiplet 40, show profiles that do not fit into the group described above, and a clear double-peaked structure separated by ~50 km s-1 is observed (see Fig. 6). The Paschen line series also displays double-peaked profiles separated by ~36 km s-1, with a rather weak central absorption component (Fig. 4), and an incipient double-peaked structure is observed in the emission lines of [O I] λλ 6300, 6363. The simple appearance of a double-peaked structure of the line profiles could indicate two possible scenarios in the line-forming region: the presence of a Keplerian rotating disk or an outflowing disk. To draw valid conclusions about the real kinematical nature in the region where those double-peaked emissions are formed, it is necessary to investigate the density and temperature structure in those disk regions, to compute the line profiles expected in both cases, and to compare them with the observed profiles (see e.g. Kraus et al. 2010).
Assuming a spectral type of supergiant B0-2 and Mbol = −8.8 mag (Lamla 1982) for the primary of GG Car, L = (2.6 ± 1.0) × 105 L⊙ and the stellar radius R = 32 ± 8 R⊙ are obtained. From the parameter Teff derived in Sect. 5 and L = 2.6 × 10⁵ L⊙, we can verify that the location of GG Car in the HR diagram – like most sgB[e] stars in the MCs and in our galaxy– is on a post-main sequence phase of evolution and located in the top lefthand part of the diagram in the ranges of L ~ 104 − 106 L⊙ and T ~ 10 000−30 000 K (Lamers et al. 1998). Using the evolutionary tracks of nonrotating and rotating stellar evolutionary models at solar metallicity given by Meynet & Maeder (2003), we can estimate the masses corresponding to the evolution track on which GG Car is located. This results in 25 M⊙ < Minitial < 4 0 M⊙ and 21 M⊙ < MPr < 34 M⊙. Adopting MPrsin3i = 18 M⊙, as obtained from our spectroscopic orbit, an orbital inclination 72° > i > 54° is estimated, which is consistent with an eclipsing binary system.
The theory of radiation-driven winds predicts that the “modified stellar wind momentum” depends directly on luminosity through the wind momentum-luminosity relationship (Kudritski & Puls 2000): 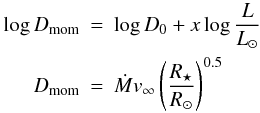 where the coefficients log D0 and x are functions of spectral type and luminosity class. By adopting the coefficients of the wind momentum-luminosity relationship for early B I stars of the solar neighborhood, log D0 = 21.24 ± 1.38 and x = 1.34 ± 0.25 given by Kudritski et al. (1999), log Dmom = 28.50 is obtained. The terminal velocity v∞ of B supergiant winds depends on Teff and on the effective escape velocity at the stellar surface. The effective escape velocity has to be calculated as the difference between the Newtonian escape and a correction for the radiation pressure due to electron scattering as
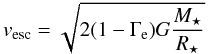
 , where σe = 0.30 cm2 gr-1 is the electron scattering coefficient per unit mass for hot star winds. The theory of radiation-driven winds predicts that the ratio v∞/vesc ~ 2.6 for stars with Teff ≥ 21 000 K (Lamers & Cassinelli 1998), and from that we obtain vesc = 377 km s-1 and v∞ = 980 km s-1, with an uncertainty in v∞ of typically 10 to 20%. The mass-loss rate of GG Car, Ṁ = (9 ± 3) × 10-7 M⊙/yr, has been derived from the previous expression of Dmom.
Kraus (2009) suggests a way to distinguish between the pre- and post-main sequence evolutionary phase of B[e] stars based on the increasing 13C abundance on the stellar surface at post-main sequence evolutionary phases. GG Car has been recently found to show the 13CO band emission, classifying it definitely as a B[e] supergiant star. However, adopting log L = 4.7 − 5.18 and log Teff = 4.2 − 4.3 (McGregor et al. 1988; Lopes et al. 1992) and the observed 12C/13C isotope ratio on the order of ≤ 10, Kraus (2009) finds a disagreement with her rotating or nonrotating model predictions. Instead, when taking our stellar parameter determinations and assuming that GG Car has evolved from a progenitor star of 25 M⊙ < Minitial < 40 M⊙, the observed 12C/13C isotope ratio fits much better with her model predictions (Fig. 6 in Kraus 2009), confirming the classification of GG Car as a sgB[e] star.
The distance at which the CO band emission originates in the B[e] supergiant stars could be estimated on the basis of temperature arguments. Kraus & Borges Fernandes (2005) and Kraus et al. (2006, 2007) have shown that the disks around B[e] stars must be predominantly neutral in H close to the stellar surface in order to reproduce the observed strong [OI] emission lines. The temperature in the [OI] line-forming regions ranges from 8000 to 6000 K, whereas the dust shell must be located farther away from the star where the disk temperature dropped to the dust evaporation temperature, approximately 1500 K (Krau 2009). On the other hand, theoretical CO band calculations have shown that the formation of pronounced band head structures requires a minimum CO temperature of about 2000 K and a dissociation temperature of about 5000 K (Kraus 1997; Kraus 2009). This argument places the CO formation region beyond the [OI] saturation and before the dust emission regions, which usually occurs at distances of around 100–300 stellar radii (Kraus et al. 2006, 2007). As a consequence, in the model proposed here for GG Car, the location of the observed CO emission would be in the region of the envelope with a temperature range of 2000–5000 K, and the distance from the central star would be shorter than 230 stellar radii.
7. Conclusions
In this paper, we have presented an observational study of the supergiant B[e] star GG Car. The observations include high-dispersion spectroscopy in a wide spectral range, collected from 1996 until 2010. A continuum energy distribution for GG Car was also obtained from the UV to the IR, using available low-dispersion spectra and photometric data from different databases. The main conclusions drawn from these obsevations are as follows.
-
For the first time, the spectroscopic orbits for both components ofthe system have been determined, obtaining an orbital period of31.033 days, which confirms the first spectroscopic period givenby HLST81 and one of the two plausible photometric periodsproposed by Gosset et al. (1984). A detailedanalysis of the He I profiles revealedphotospheric absorption lines blended with the P-Cygni profiles,indicating that the system could be conformed by two B-typestars. The radial velocity curves for the primary and secondarycomponents were obtained from the blueshifted absorptions ofHe I λλ4471, 5875, 6678, and 7065. From the best combined orbital solutions, corresponding to an eccentric orbit with e = 0.28, the projected binary separation Asin i = 0.57 AU, and the component masses MPrsin3i = 18 ± 3 M⊙ and MSecsin3i = 8 ± 2 M⊙ were obtained, therefore a mass ratio q = MPr/MSec = 2.2 ± 0.9 was derived.
-
A simple model of an envelope made of gas and dust are presented as well as its effect on the spectral energy distribution considering a single central B-type star. It was calculated that a contribution of a secondary B-type star to the flux distribution would be negligible, and the results presented here are not strongly modified if we consider two B-type stars instead of a single central star. B-type flux models (Kurucz 1979) are considered to be surrounded by a circumstellar material distributed in two different regions: a gaseous shell located close to the star at a few stellar radii, and a dust shell farther away, more than a hundred stellar radii. By comparing theoretical results with observations, we can derive fundamental parameters of the stars, as well as global physical properties of the gas and dust envelopes. The best fitting was achieved for a temperature of Teff = 23 000 ± 2000 K. The circumstellar material results in a gaseous envelope to 3.5 stellar radii from the central star, with T ~ 11 500 K and other outermost hot dust layers with EB − V = 0.30. For the interstellar medium, an EB − V = 0.18 was added. The resulting effective temperature is consistent with a spectral type B0-B2.
-
Values of the distance to the system of 5 ± 2 Kpc and 5 ± 1 Kpc were obtained from two independent methods.
Acknowledgments
We are grateful to Lydia Cidale for providing us CASLEO low-resolution spectrograms and for her valuable comments on the manuscript. We would like also to thank Andrea Torres for providing her calibration programs and to the anonymous referee for suggestions and critical remarks that helped to improve the paper. This research made use of the NASA Astrophysics Data System (ADS) and of the SIMBAD, VizieR, IUE, 2MASS, ISO, and MSX databases. The CCD and data acquisition system at CASLEO has been partly finance by R. M. Rich through US NSF grant AST-90-15827.
References
- Balluch, M. 1988, A&A, 200, 58 [NASA ADS] [Google Scholar]
- Barbier, R., & Swings, J.-P. 1982, in Be Stars (Dordrecht: D. Reidel Publishing Co.), IAU Symp., 98, 103 [NASA ADS] [Google Scholar]
- Borges-Fernandes, M. 2010, Rev. Mex. Astron. Astrophys. Conf. Ser., 38, 98 [Google Scholar]
- Bouwman, J., de Koter, A., van den Ancker, M. E. and Waters, L. B. F. M. 2000, in Thermal Emission Spectroscopy and Analysis of Dust, Disks, and Regoligths, ed. M. L. Sitko, A. L. Sprague, & D. K. Lynch, ASP Conf. Ser., 196, 63 [Google Scholar]
- Brandi, E., Gosset, E., Swings, J.-P. 1987, A&A, 175, 151 [NASA ADS] [Google Scholar]
- Cardelli, J. A., Clayton, G. C., & Mathis, J. S. 1989, ApJ, 345, 245 [NASA ADS] [CrossRef] [Google Scholar]
- Cidale, L. S., & Ringuelet, A. E. 1989, PASP, 101, 417 [NASA ADS] [CrossRef] [Google Scholar]
- Clark, J. S., & Steele, I. A. 2000, A&AS, 141, 65 [NASA ADS] [CrossRef] [EDP Sciences] [Google Scholar]
- de Freitas Pacheco, J. A. 1998, in B[e] Stars: Proceedings of the Paris Workshop, ASSL, 233, 221, ed. A. M. Hubert, & C. Jaschek (Kluwer Academic Publishers) [Google Scholar]
- Cohen, M., Wheaton, W. A., & Megeath, S. T. 2003, AJ, 126, 1090 [NASA ADS] [CrossRef] [Google Scholar]
- Gnedin, Y. N., Niselev, N. N., Pogodin, M. A., & Rozenbush, V. K. 1992, Soviet Astr. Lett., 18, 182 [Google Scholar]
- Gosset, E., Surdej, J., & Swings, J.-P. 1984, A&AS, 55, 411 [NASA ADS] [Google Scholar]
- Gosset, E., Hutsemkers, D., Surdej, J., & Swings, J.-P. 1985, A&A, 153, 71 (GHSS85) [NASA ADS] [Google Scholar]
- Hamuy, M., Walker, A. R., Suntzeff, N. B., et al. 1992, PASP, 104, 533 [NASA ADS] [CrossRef] [Google Scholar]
- Hamuy, M., Suntzeff, N. B., Heathcote, S. R., et al. 1994, PASP, 106, 566 [NASA ADS] [CrossRef] [Google Scholar]
- Hernández, C. A., Lopez, L., Sahade, J., & Thackeray, A. D. 1981, PASP, 93, 747 (HLST81) [NASA ADS] [CrossRef] [Google Scholar]
- Jenniskens, P., & Désert, F.-X. 1994, A&AS, 106, 39 [NASA ADS] [Google Scholar]
- Klare, G., & Neckel, T. 1977, A&AS, 27, 215 [NASA ADS] [Google Scholar]
- Kraus, M. 1997, CO Band emission from a rotating disk, Diploma Thesis, University of Bonn [Google Scholar]
- Kraus, M. 2006, A&A, 456, 151 [NASA ADS] [CrossRef] [EDP Sciences] [Google Scholar]
- Kraus, M. 2009, A&A, 494, 253 [NASA ADS] [CrossRef] [EDP Sciences] [Google Scholar]
- Kraus, M., & Borges Fernandes, M. 2005, in The nature and evolution of disks around hot stars, ed. R. Ignace, & K. G. Gayley (San Francisco: ASP), ASP Conf. Ser., 337, 254 [Google Scholar]
- Kraus, M., Borges Fernandes, M., & de Araújo, F. X. 2007, A&A, 463, 627 [NASA ADS] [CrossRef] [EDP Sciences] [Google Scholar]
- Kraus, M., Borges Fernandes, M., & de Araújo, F. X. 2010, A&A, 517, A30 [NASA ADS] [CrossRef] [EDP Sciences] [Google Scholar]
- Kudritski, R. P., Puls, J., Lennon, D. J., et al. 1999, A&A, 350, 970 [NASA ADS] [Google Scholar]
- Kudritski, R. P., & Puls, J. 2000, ARA&A, 38, 613 [NASA ADS] [CrossRef] [Google Scholar]
- Kurucz, R. L. 1979, ApJS, 40, 1 [NASA ADS] [CrossRef] [Google Scholar]
- Lamers, H. J. G. L. M., Zickgraf, F.-J, de Winter, D.,Houziaux, L., & Zorec, J. 1998, A&A, 340, 117 [NASA ADS] [Google Scholar]
- Lamla, E. 1982, in Landolt-Brnstein, New Series Group IV (Berlin Heidelberg New York: Springer-Verlag), 2, 370 [Google Scholar]
- Lopes, D. F., Damineli Neto, A., & de Freitas Pacheco, J. A. 1992, A&A, 261, 482 [NASA ADS] [Google Scholar]
- McGregor, P. J., Hayland, A. R., & Hillier, D. J. 1988, ApJ, 324, 1071 [NASA ADS] [CrossRef] [Google Scholar]
- Meynet, G., & Maeder, A. 2003, A&A, 404, 975 [NASA ADS] [CrossRef] [EDP Sciences] [Google Scholar]
- Moujtahid, A. 1998, Thèse de Doctorat, Université Paris VI [Google Scholar]
- Moujtahid, A., Zorec, J., & Hubert, A. M. 1999, A&A, 349, 15 [Google Scholar]
- Munari, U., & Zwitter, T. 1997, A&A, 318, 269 [NASA ADS] [Google Scholar]
- Muratore, et al. 2010, in Active OB stars: structure, evolution, mass loss and critical limits, ed. C. Neiner, G. Wade, G. Meynet & G. Peters, Proc. IAU Sym., 272, 620 [Google Scholar]
- Oudmaijer, R. O., Proga, D., Drew, J. E., & de Winter, D. 1998, MNRAS, 300, 170 [NASA ADS] [CrossRef] [Google Scholar]
- Pereyra, A., de Araújo, F. X., Magalhães, A. M., Borges Fernandes, M., & Domiciano de Souza, A. 2009, A&A, 508, 1337 [NASA ADS] [CrossRef] [EDP Sciences] [Google Scholar]
- Schmidt-Kaler, Th. 1982, in Landolt-Brnstein New Series, Group IV, ed. K. Schaifers & H. H. Voigt (Berlin, Heidelberg: New York: Springer), 2b [Google Scholar]
- Swings, J.-P. 1974, A&A, 34, 333 [NASA ADS] [Google Scholar]
- Sloan, G. C., Kraemer, K. E., Price, Stephan, D., & Shipman, R. F. 2003, ApJS, 147, 379 [NASA ADS] [CrossRef] [Google Scholar]
- Voors, R. H. M. 1999, Infrared studies of hot stars with dust, Ph.D. Thesis, Universiteit Utrecht, The Netherlands [Google Scholar]
- Zorec, J. 1998, in B[e] Stars: Proceedings of the Paris Workshop, ASSL, 233, 27, ed. A. M. Hubert, & Carlos Jaschek (Kluwer Academic Publishers) [Google Scholar]
- Zorec, J., Cidale, L., Arias, M. L., et al. 2009, A&A, 501, 297 [NASA ADS] [CrossRef] [EDP Sciences] [Google Scholar]
All Tables
Spectroscopic observations of GG Car and the mean radial velocities of He I λλ4471, 5875, 6678, and 7065 absorption lines for both components of the binary.
Orbital solutions of GG Car obtained from the HeI absorption lines λλ4471, 5875, 6678, and 7065 Å.
Parameters obtained using a Kurucz’ model for Teff = 23 000 K, log g = 3 and a gaseous + dust envelope.
All Figures
|
Fig. 1 Variations in the He I λ5875 profile along the orbital phases. Several blueshifted absorption components superimposed on a broad emission are observed. |
| In the text | |
|
Fig. 2 Fill circle: primary component. Empty circle: secondary component. Continuous curve: the best fit of the orbital solutions. |
| In the text | |
|
Fig. 3 Left panel: Beals’ type III PCygni profiles in the Balmer lines. The radial velocities of the central absorptions are almost constant, but in Hα they show temporal changes in the velocities, which seem to be related to the orbital cycles rather than to the orbital phases (right panels). |
| In the text | |
|
Fig. 4 H I profiles along the orbital phases. Two peaks are always observed, with the red peak stronger than the blue one. Left: Hα profiles. A weakening in the emission is produced at phases 0.15 and 0.87. Right: P13 profiles of the Paschen Series. |
| In the text | |
|
Fig. 5 Left panel: the Fe II lines members of multiplet 42 show PCygni profiles similar to those of the Balmer lines. Right panel: profile variations of one member of multiplet 42, Fe II λ4923, with the orbital phases. |
| In the text | |
|
Fig. 6 Fe II emission lines in GG Car. |
| In the text | |
|
Fig. 7 Profiles of the permitted lines of the O I triplet and their variations with the phases. Vertical bars indicate the laboratory wavelengths for the triplet components. |
| In the text | |
|
Fig. 8 Na I profiles in GG Car for different phases. Vertical bars indicate the laboratory wavelengths for each component of the doublet. |
| In the text | |
|
Fig. 9 Top: the observed energy distribution of GG Car and the theoretical model that considers a single central star with Teff = 23 000 K and log g = 3. Bottom: the individual components of the fitting. |
| In the text | |
Current usage metrics show cumulative count of Article Views (full-text article views including HTML views, PDF and ePub downloads, according to the available data) and Abstracts Views on Vision4Press platform.
Data correspond to usage on the plateform after 2015. The current usage metrics is available 48-96 hours after online publication and is updated daily on week days.
Initial download of the metrics may take a while.