Fig. 1
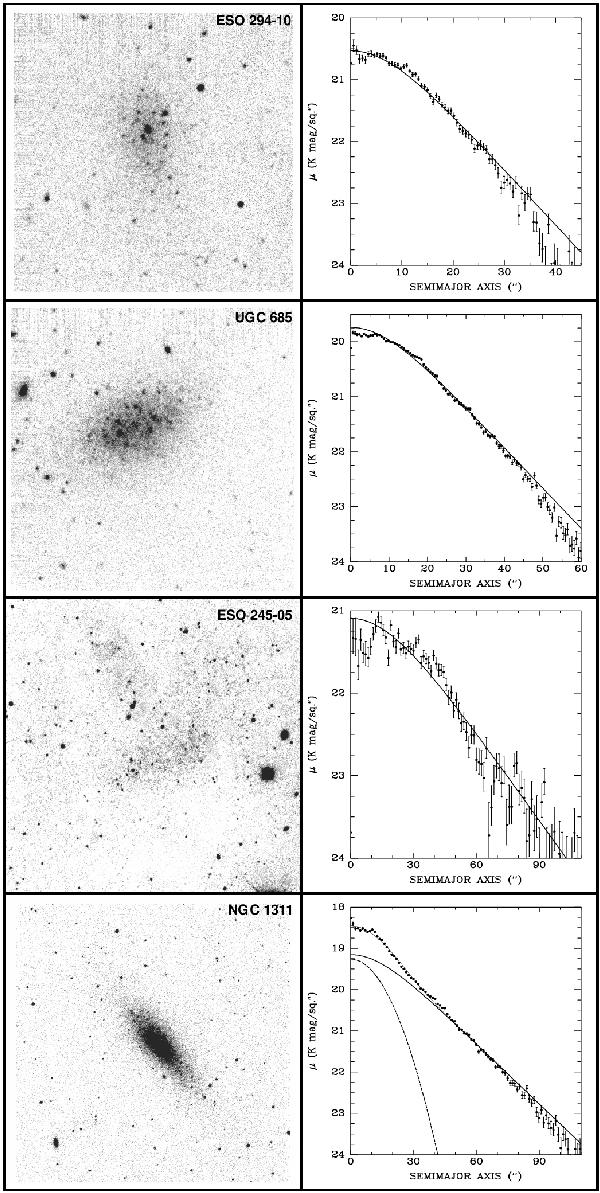
Images and surface photometry of dIs observed at CTIO (Blanco) and La Silla (NTT). Left panels: Ks images (North is up, East to the left). The field of view is about 5′ × 5′ (Blanco) or  (NTT). Right panels: surface brightness profiles in Ks for the unresolved components. The thick solid curves are fits of a sech function. In a few cases, a Gaussian burst was fitted simultaneously, and is marked by a dashed curve. In these cases, the sum of the sech and Gaussian components is shown as a thin solid line (sometimes hard to see due to overlap with the observations).
Current usage metrics show cumulative count of Article Views (full-text article views including HTML views, PDF and ePub downloads, according to the available data) and Abstracts Views on Vision4Press platform.
Data correspond to usage on the plateform after 2015. The current usage metrics is available 48-96 hours after online publication and is updated daily on week days.
Initial download of the metrics may take a while.