Fig. 6
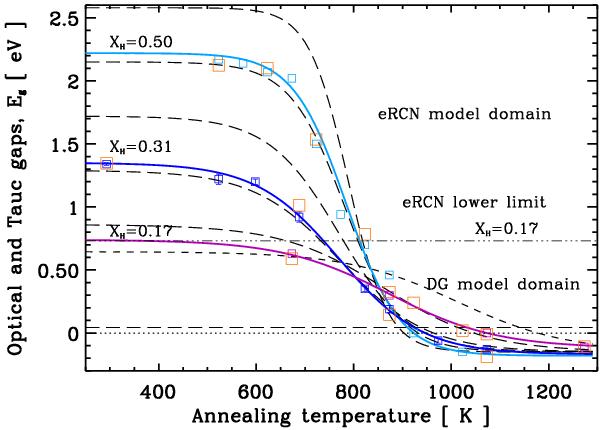
The Tauc gap, Eg, for (hydro)carbon materials as a function of the annealing temperature. Light blue squares: Smith (1984) data. Blue squares: Mennella et al. (1995) data. Purple squares: DDOP data. The orange squares show the derived Tauc gaps (see Appendix A). The solid lines show the analytical fits to each data set using Eq. (15). The long-dashed lines show the analytical fits for XH = 0.1,0.6 (0.1), from top to bottom, and the short dashed line shows the fit for XH = 0.15, using Eq. (16). The horizontal dashed-triple dotted line shows the lower limit to the validity of the eRCN model.
Current usage metrics show cumulative count of Article Views (full-text article views including HTML views, PDF and ePub downloads, according to the available data) and Abstracts Views on Vision4Press platform.
Data correspond to usage on the plateform after 2015. The current usage metrics is available 48-96 hours after online publication and is updated daily on week days.
Initial download of the metrics may take a while.