Fig. 5
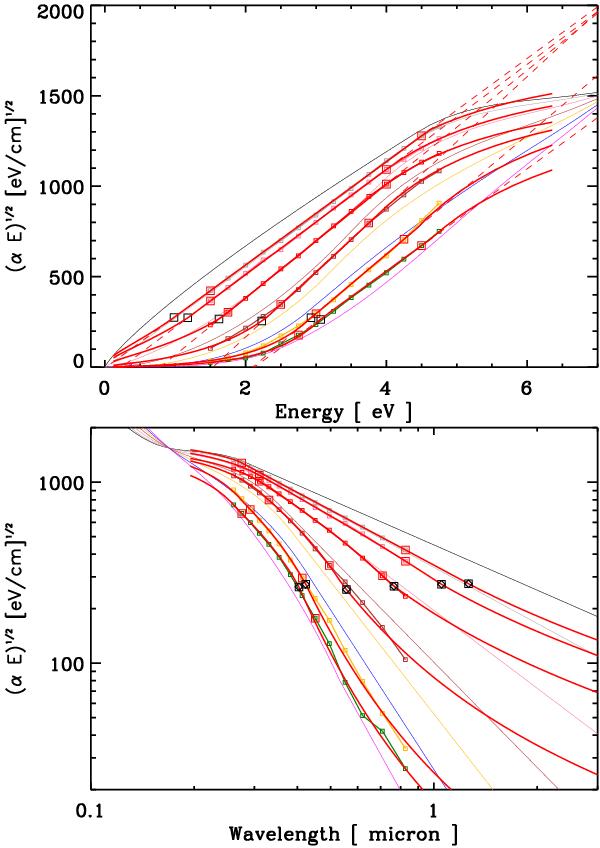
The laboratory data from Smith (1984) plotted as (αE)0.5 vs. energy (upper plot), coloured curves with small data points, i.e., a Tauc plot, and also versus wavelength (lower plot). The red lines show the modelled fits to the data using Eqs. (8) and (9), with an “inversed-Gaussian” wing at high energies. The red squares delineate the portion used to determine B and the extrapolation to the Tauc gap, Eg. The black squares indicate the transition energies to the Urbach tail, E1.
Current usage metrics show cumulative count of Article Views (full-text article views including HTML views, PDF and ePub downloads, according to the available data) and Abstracts Views on Vision4Press platform.
Data correspond to usage on the plateform after 2015. The current usage metrics is available 48-96 hours after online publication and is updated daily on week days.
Initial download of the metrics may take a while.