Fig. 4
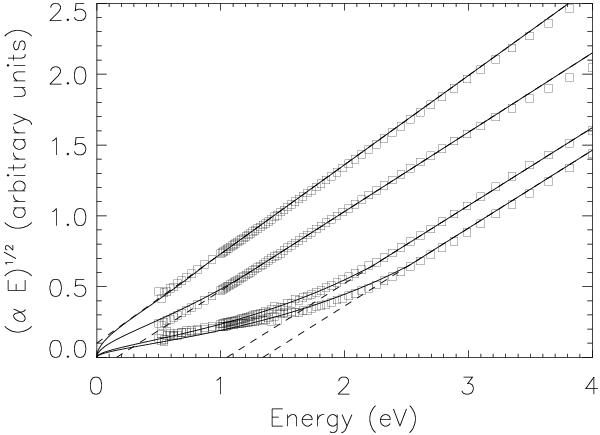
A schematic Tauc plot for bulk hydrocarbon data (Mennella et al. 1995). From bottom to top the deposition annealing temperature increases from 20 to 800 °C. The dashed lines show the extrapolation of the linear portions to derive the Tauc gap Eg.
Current usage metrics show cumulative count of Article Views (full-text article views including HTML views, PDF and ePub downloads, according to the available data) and Abstracts Views on Vision4Press platform.
Data correspond to usage on the plateform after 2015. The current usage metrics is available 48-96 hours after online publication and is updated daily on week days.
Initial download of the metrics may take a while.