Fig. 2
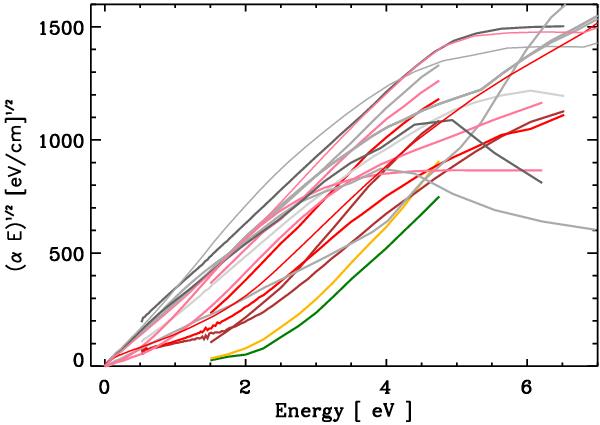
The same data, and the same colour-coding scheme, as in Fig. 1 but presented in the form of a Tauc plot, i.e., (αE)0.5 vs. energy. The band gap increases from the upper to lower curves. See the text for details.
Current usage metrics show cumulative count of Article Views (full-text article views including HTML views, PDF and ePub downloads, according to the available data) and Abstracts Views on Vision4Press platform.
Data correspond to usage on the plateform after 2015. The current usage metrics is available 48-96 hours after online publication and is updated daily on week days.
Initial download of the metrics may take a while.