Fig. 16
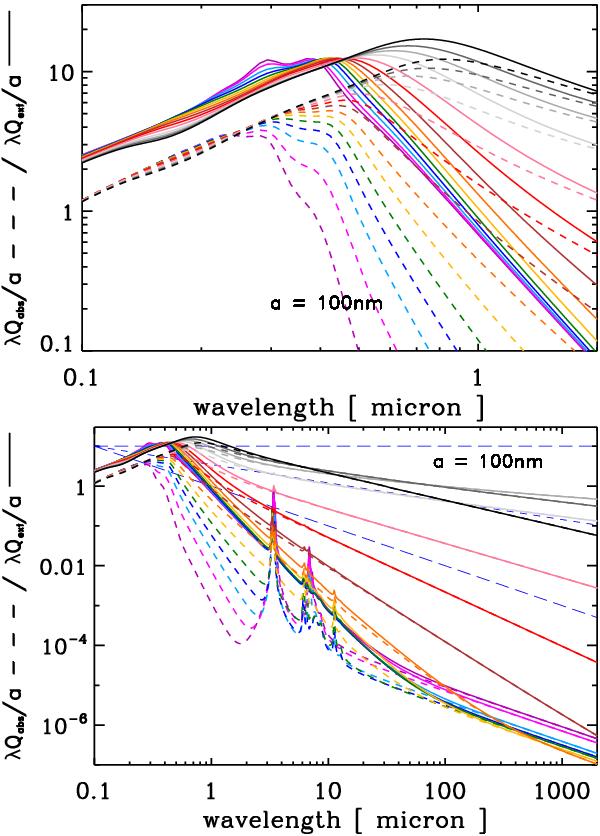
The optEC(s) model extinction and absorption coefficient data, for clarity plotted as λQext/a (solid lines) and λQabs/a (dashed lines), as a function of Eg and wavelength for 100 nm radius particles. From top to bottom on the right the dashed blue lines indicate wavelength dependencies, λ − β, where β = 1, 1.5 and 2.
This figure is made of several images, please see below:
Current usage metrics show cumulative count of Article Views (full-text article views including HTML views, PDF and ePub downloads, according to the available data) and Abstracts Views on Vision4Press platform.
Data correspond to usage on the plateform after 2015. The current usage metrics is available 48-96 hours after online publication and is updated daily on week days.
Initial download of the metrics may take a while.