Fig. 14
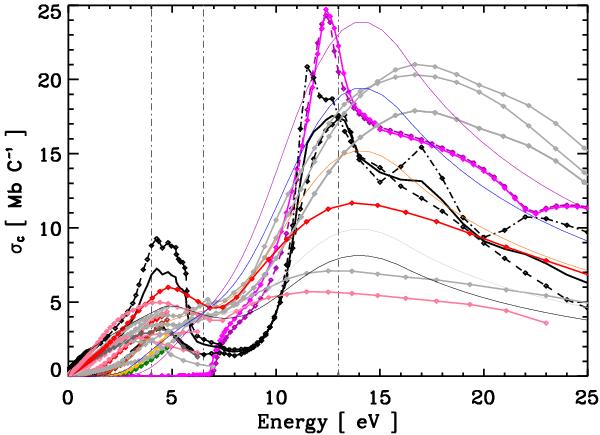
The cross-section per carbon atom, σC (in Mb per C atom, 1 Mb = 10-18 cm2), for the optEC(s) model (smooth curves peaking at ~14 eV, for the extreme and three intermediate Eg cases), compared to laboratory data and other models. The vertical dot-dashed lines mark the band centres of the π − π∗, C6 and σ − σ∗ bands at 4.0, 6.5 and 13 eV, respectively. The diamond (purple and violet lines) and graphite data (black) are shown for comparison.
Current usage metrics show cumulative count of Article Views (full-text article views including HTML views, PDF and ePub downloads, according to the available data) and Abstracts Views on Vision4Press platform.
Data correspond to usage on the plateform after 2015. The current usage metrics is available 48-96 hours after online publication and is updated daily on week days.
Initial download of the metrics may take a while.