Fig. 12
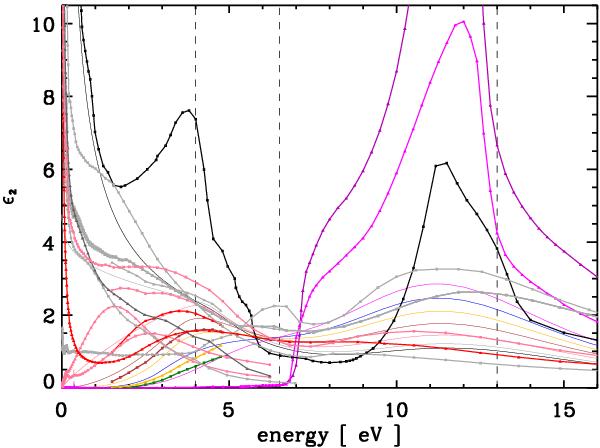
The imaginary part of the dielectric function, ϵ2, for the optEC(s) model (lines without data points) compared to laboratory and other model data (lines with data points). The diamond (purple and violet lines) and graphite data (black) are shown for comparison. The vertical dashed lines mark the band centres of the π − π∗, C6 and σ − σ∗ bands at 4.0, 6.5 and 13 eV, respectively.
Current usage metrics show cumulative count of Article Views (full-text article views including HTML views, PDF and ePub downloads, according to the available data) and Abstracts Views on Vision4Press platform.
Data correspond to usage on the plateform after 2015. The current usage metrics is available 48-96 hours after online publication and is updated daily on week days.
Initial download of the metrics may take a while.