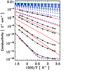
Fig. 10
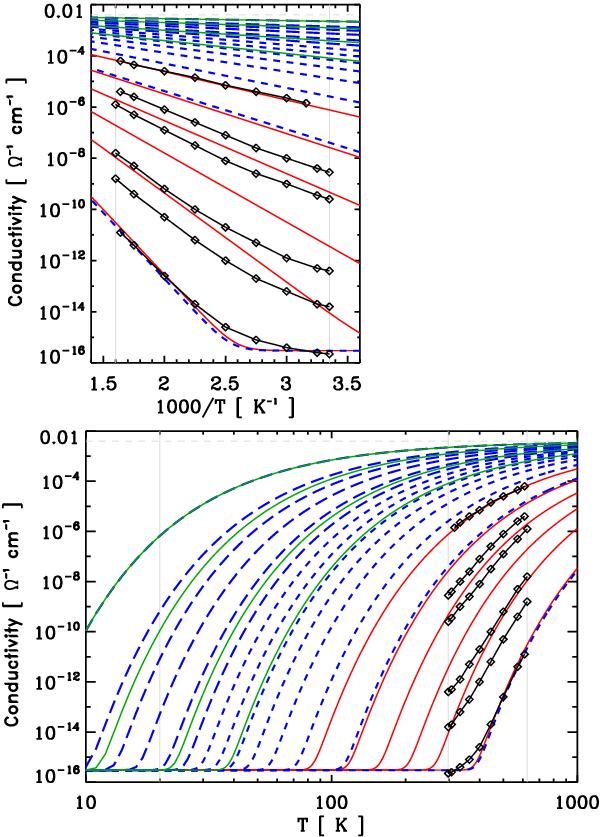
The conductivity of a-CH and a-C materials (a-C:H – black lines with data points, as per Fig. 33 of Robertson (1986); red lines – fits to these a-C:H data using Eq. (29); green lines – fits for a-C, using the Doyama et al. 2001, activation energies) compared to those predicted for the eRCN a-C:H/a-C (short-dashed blue) and DG a-C models (long-dashed blue) by Eq. (29).
Current usage metrics show cumulative count of Article Views (full-text article views including HTML views, PDF and ePub downloads, according to the available data) and Abstracts Views on Vision4Press platform.
Data correspond to usage on the plateform after 2015. The current usage metrics is available 48-96 hours after online publication and is updated daily on week days.
Initial download of the metrics may take a while.