| Issue |
A&A
Volume 540, April 2012
|
|
|---|---|---|
| Article Number | A107 | |
| Number of page(s) | 7 | |
| Section | Planets and planetary systems | |
| DOI | https://doi.org/10.1051/0004-6361/201117617 | |
| Published online | 05 April 2012 | |
Effects of disk irradiation on planet population synthesis
1 Physikalisches Institut, Universitaet Bern, 3012 Bern, Switzerland
e-mail: This email address is being protected from spambots. You need JavaScript enabled to view it.
, This email address is being protected from spambots. You need JavaScript enabled to view it.
; This email address is being protected from spambots. You need JavaScript enabled to view it.
2 Institut UTINAM, CNRS-UMR 6213, Observatoire de Besançon, BP 1615, 25010 Besançon Cedex, France
3 Max-Planck Institute for Astronomy, Königstuhl 17, 69117 Heidelberg, Germany
e-mail: This email address is being protected from spambots. You need JavaScript enabled to view it.
Received: 1 July 2011
Accepted: 2 December 2011
Abstract
Context. Planet formation is strongly dependent on disk properties. The surface density of gas and solids influences the formation of planetesimals and subsequently that of planetary cores. The temperature structure, on the other hand, affects planet migration and, as a result, the outcome of planet formation.
Aims. We extended our previous disk structure calculations to include the effect of stellar irradiation in addition to viscous heating. We then used these new structures to compute new synthetic planet populations that we compared to those obtained without taking into account stellar irradiation.
Methods. Our disk models are standard alpha-disk models calculated in the 1+1D approximation. The effect of the irradiation by the central star is treated by imposing an appropriate outer boundary conditions on temperature. The disks evolve through viscous transport and photo-evaporation on timescales that match observations.
Results. When compared to the nominal non-irradiated case, the irradiated disk is, as expected, warmer beyond a few AUs. This translates into a greater scale-height, which implies, everything else being equal, a transition from type I to type II migration for larger core masses. Because type I migration is heavily damped in our nominal model and that type II starts at larger masses, the nominal model with an irradiated disk fails to account for the presence of the numerous hot Jupiters. In other words, the effect of accounting for irradiation is strong in conjunction with a heavily damped type I migration rate.
Conclusions. We find that reducing the slowing down of the type I migration rate to a factor ten below the linear value (instead of a factor 103 as in the nominal model) is enough to retrieve a giant planet population consistent with observations. The same effect is observed if we change the transition from type I to type II by varying the nominal criterion without considering irradiation.
Key words: accretion, accretion disks / planets and satellites: formation / protoplanetary disks
© ESO, 2012
1. Introduction
More than 20 years ago, the infrared as well as the UV excess observed in the spectral energy distribution (SEDs) were the only tools at our disposal for inferring the existence of circumstellar disks. The infrared excess that was seen on top of the expected blackbody emission of the star was soon understood to be reprocessed light from the star by much cooler, circumstellar material. The UV excess, on the other hand, was caused by accretion of the material on the star. These circumstellar disks were for a long time studied only theoretically and models for their structure were degenerate owing to the lack of observational constraints. To date, with more than 159 resolved disks observed (see http://www.circumstellardisks.org/), multi-methods and multi-wavelength observations have become the method of choice to derive the structure of these planetary birthplaces (see Duchêne et al. 2004; Pinte et al. 2008).
The importance of the disk as a source for gas supply to form giant planets was recognized very early on. However, with the discovery of hot Jupiters, it became clear that planet migration resulting from the tidal torques on the planet exerted by the perturbations in the disk induced by the presence of a planet should also be a key ingredient in any planet formation theory, see Papaloizou et al. (2007) for a review. According to the linear perturbation analysis of isothermal disks, cores and small planets (up to ≃ 0.1 Jupiter masses) migrate inward fast without creating a gap in the disk (type I migration). More massive planets (from ≃ 1 Jupiter mass) create a gap and migrate inward on the viscous timescale of the disk (type II migration). Intermediate-mass planets may be in the so-called type III or runaway migration regime that depends sensitively on the disk density and temperature profile. In more recent works, the disk is not considered to be isothermal anymore. Corotation torques and even self-gravity are also taken into account. These works show that type I migration is more complex than originally thought possible for outward migration (see Paardekooper & Mellema 2006, 2008; Kley & Crida 2008; Baruteau & Masset 2008a,b; Kley et al. 2009; Paardekooper et al. 2010, 2011).
Integrated models are now built to compute planet formation consistently with their disk environment. In their seminal work, Pollack et al. (1996) showed that giant planets form in three steps. First, a core forms rapidly by accreting all planetesimals located in the feeding zone of the planet. The width of this zone scales with the planet’s Hill radius. After the depletion of the feeding zone, the subsequent gain in mass proceeds at a much slower pace. The core is now massive enough to be able to bind some nebular gas that forms an envelope in hydrostatic equilibrium. This results in a slightly larger Hills radius and therefore in the accretion of additional planetesimals that increase the core mass. More gas can be accreted and the process repeats itself on a timescale essentially governed by the speed with which the core can accrete gas given the heating of infalling planetesimals. The process ends when the energy released by planetesimals is not sufficient to compensate for radiative losses at the planet’s surface. At this point, the envelope contracts onto the core and runaway gas accretion takes place (stage 3). Pollack et al. (1996) showed that this process of formation was very sensitive to the surface density of the disk at the location of planet formation with a standard minimum mass solar nebula, leading to formation times far exceeding the disk lifetime.
Subsequently, Alibert et al. (2005, hereafter AMBW05)pointed out that formation and migration timescales are comparable and that both processes should be included self-consistently during the formation process. Allowing for the migration of the growing core, they showed that the length of stage 2 above can be considerably shortened by a feeding zone that is never completely depleted because the migrating core always encounters new planetesimals to accrete. This effect has lead to giant planet accretion timescales that agree well with disk lifetimes as inferred from observations.
In the work by Pollack et al. (1996), the disk was assumed to be in a steady state. However, since the lifetime of the disks is on the same order (or perhaps even shorter) than the formation time of a giant gaseous planet, it is imperative to consider its concurrent evolution in a consistent manner. This was done by AMBW05, who included the viscous evolution (including the dissipation) of the disk by means of a simple α model as well as photo-evaporation. While this allowed for the first time to couple a physical disk evolution model to a planet formation model, the approach still did not include the effects caused by the irradiation of the disk by the central star. As shown already by Alibert et al. (2011), the characteristics of the disk play a central role in determining which types of planets will be able to form. Hence, we expect that in the cases for which irradiation changes the structure of the disk in the planet forming region, significant changes in the planet population occur as well.
Because a fully self-consistent treatment of irradiation is beyond the present capability of the code, we explored a simplified version in which irradiation only changes the surface boundary condition as introduced by Hueso & Guillot (2005). Hence, there are no shadowing effects and the flaring angle is not computed in a self-consistent manner but set to its equilibrium value. At present, the irradiation treatment is therefore very basic and should be considered only as a tool to qualitatively investigate the effect of irradiation on planet formation. In this spirit, we will present the results of planet population synthesis in non-irradiated and in irradiated disks to directly compare them. We did not directly attempt to quantitatively match observed planet populations but we used observed properties in a qualitative way to assess the synthetic populations.
2. Code description and validation
Except for the calculation of the structure of the gaseous disk (see below), the planet population synthesis approach used in the present paper is the same as in Alibert et al. (2005); Mordasini et al. (2009a,b) and Alibert et al. (2009). Our approach allows in a self-consistent manner to compute the growth of seed cores implanted in a population of circumstellar disks. Since this approach has already been described in sufficient details, we refer the reader to the papers mentioned above for more details about the procedure. Here, we concentrate on the calculation of the disk structure and evolution, which is the subject of our study.
We computed the structure and evolution of the proto-planetary disk in two steps. In the first step, we derived the vertical structure of the disk between the mid-plane and the photosphere as a function of distance to the star. We used cylindrical coordinates (r,θ,z) and assumed the disk midplane to lie at z = 0. This vertical structure is obtained by solving the equations of hydrostatic equilibrium 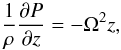 (1)of energy conservation
 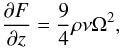 (2)and the diffusion equation for the radiative flux
 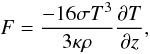 (3)where ρ is the volume density, P the pressure, Ω the Kepler angular velocity, F the radiative flux, ν the viscosity, σ the Stefan-Boltzmann constant and κ the opacity. These three equations are integrated starting from the disk “surface” H (defined as the height where the optical depth is 10-2, see Papaloizou & Terquem 1999) down to the disk mid-plane, with four boundary conditions, three at the surface and one at the center:
 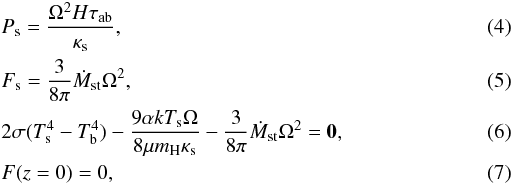 where the subscript s refers to values taken at z = H, τab is the optical depth above the disk,
  with
with  and Σ is the surface density. Tb is the background temperature,
  is the viscosity parameter (Shakura & Sunyaev 1973) and cs the sound speed. k is the Boltzmann constant, μ the molar mass of the gas and mH the mass of the hydrogen atom.
Only one value of the disk thickness (H) allows us to simultaneously fulfill all boundary conditions. We therefore have to iterate to obtain it. The detailed vertical computation of the temperature gives us the correct value for  that depends on T through cs. We did not assume the disk to be vertically isothermal.
We then computed the radial evolution of the disk by solving the equation for viscous evolution: ![Mathematical equation: \begin{equation} \frac{\partial \Sigma}{\partial t} = \frac{3}{r} \frac{\partial }{\partial r} \left[ r^{1/2} \frac{\partial }{\partial r} (\Sigma \bar \nu r^{1/2}) \right]. \end{equation}](/articles/aa/full_html/2012/04/aa17617-11/aa17617-11-eq33.png) (8)We refer the reader to AMBW05 for more details
(8)We refer the reader to AMBW05 for more details
For our studies, we modified this disk structure computation to include the irradiation of the disk by the central star in a simplified manner. A full calculation is complex because one would have to consider three components:
-
the partially absorbed incident flux (beamed, at the stellartemperature T⋆)
-
the part of the incident flux that is scattered in the disk (close to isotropic, at the stellar temperature T⋆)
-
the part of the flux that is absorbed and re-radiated by the disk (close to isotropic, at the disk temperature Tdisk).
Such complex calculations have already been performed by others (e.g. D’Alessio et al. 1998; Dullemond et al. 2002) and ideally, one would like to use this approach as well. Unfortunately, planet population syntheses are themselves already time-consuming calculations because the growth of several tens of thousands of embryos must be followed and therefore additional physics can only be included, at least for the time being, in a simplified way. Furthermore, the computation of the growth of the planets themselves has been simplified in a way to depend only on the mid-plane properties and the local disk scale height and not on the detailed local properties. Hence, using a simplified treatment is warranted given the overall level simplifications already present in our approach. Nevertheless, we checked that our values for the mid-plane quantities as well as the scale height of the disk as a function of distance to the star agree well with those obtained by a more sophisticated approach.
The effect of the irradiation by the central star is modeled by modifying the temperature boundary condition at the disk surface. In an irradiated disk, this temperature is set to  where the irradiation temperature is the one derived in Hueso & Guillot (2005):
 ![Mathematical equation: \begin{equation} \tsurfirr=T_* \left[\frac{2}{3 \pi}\left(\frac{R_*}{r}\right)^3+\frac{1}{2}\left(\frac{R_*}{r}\right)^2\left(\frac{H_\mathrm{P}}{r}\right)\left(\frac{\mathrm{d\, ln}\, H_\mathrm{P}}{\mathrm{d\, ln}\, r}-1\right)\right]^{1/4}, \end{equation}](/articles/aa/full_html/2012/04/aa17617-11/aa17617-11-eq37.png) (9)where R ∗ is the stellar radius, r is the distance to the star and HP is the pressure scale height defined as ρ(z = HP) = ρ(z = 0)exp( − 1/2). The first term on the right corresponds to the flux that would be intercepted by a flat disk, the second term is the contribution of the flaring of the disk to the stellar flux absorption. This expression has been derived assuming that
(9)where R ∗ is the stellar radius, r is the distance to the star and HP is the pressure scale height defined as ρ(z = HP) = ρ(z = 0)exp( − 1/2). The first term on the right corresponds to the flux that would be intercepted by a flat disk, the second term is the contribution of the flaring of the disk to the stellar flux absorption. This expression has been derived assuming that  =
=  =
=  and hence is valid only at long distances to the star. The flaring angle, d ln HP / d ln r is taken at its equilibrium value 9/7 (Chiang & Goldreich 1997). We note that our approximations only hold as long as enough gas is present in the disk to completely absorb the stellar flux, namely when the optical depth τ is much higher than unity. The latter should in principle be calculated using opacities for a gas/dust mixture at the disk temperature Tdisk (assuming that the gas and dust are in equilibrium) embedded in a radiation field at the stellar temperature T ⋆ , and along the direction of the incident flux. Again we used τ ≃ Σκ as an approximation for the sake of simplicity, where Σ is the gas surface density. κ is the equilibrium opacity of the gas+dust component and is derived from Bell & Lin (1994).
As a test of our prescription, we compared the mid-plane temperature in a disk with a constant accretion rate (Ṁ = 10-8 M⊙/yr) with the values obtained by D’Alessio et al. (1998). The results are shown in Fig. 1. We begin by pointing out that including irradiation leads to substantially warmer disks at long distances to the star compared to cases where irradiation is neglected (see Fig. 1, top left). This is to be expected and results from the flaring of the disk and can be easily qualitatively explained. Viscous heating decreases sharply with distance to the star because it depends primarily on surface density and on Ω. On the other hand, stellar irradiation strikes the disk (as long at least as it is flat, i.e. with HP ∝ r) at any distance, the energy deposited depending upon the surface intercepting the radiation. Flared disk offer a larger collecting area and collect even more energy than flat disks. Hence, irradiation by the central star results in disks with flatter temperature profiles because the relative contribution by irradiation over viscous dissipation increases with distance to the star. We obtain a good match for the mid-plane and photosphere temperatures for the comparison with D’Alessio et al. (1998), (see Fig. 1, top right) as well as for the surface density (see Fig. 1, bottom left) and pressure scale height (see Fig. 1, bottom right). Finally, we note that as pointed out by Dullemond et al. (2002), our temperatures and those obtained by D’Alessio et al. (1998) are higher in the mid-plane than those obtained if frequency-dependent opacities are used.
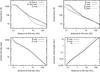 |
Fig. 1 Top row left: miplane temperature for the disk with irradiation (solid line), without irradiation (dashed line) and in the model by D’Alessio et al. (1998); (dotted line). Right: comparison of our model with irradiation (B) and that by D’Alessio et al. (1998) (D): miplane temperature (ours: solid line, D’Alessio: dashed line), photospheric temperature (dotted line, D’Alessio: short dotted line). Bottom row left: surface density (ours: solid line, D’Alessio: dashed line). Right: pressure scale height (ours: solid line, D’Alessio: dashed line, fit with |

To be able to compare our results at least qualitatively with observed disks, we computed the SED of our disk in the pole-on configuration following Chiang & Goldreich (1997). The star radiates as a blackbody at a temperature T∗. The disk is divided into a set of annuli that radiate as a blackbody at the photospheric temperature derived from the computation of the vertical structure. The sum of all contributions is computed and plotted as a function of frequency (Fig. 2).
As expected, the difference between the SED of a disk computed with and without taking irradiation into account is striking. In the non-irradiated case, the flux in the millimeter domain decreases sharply because the flux in this wavelength range is dominated by the outer regions of the disks for which irradiation plays a major role, as we have seen in Fig. 1. A sharp decrease in the millimeter domain such as the one seen in the non-irradiated disk is extremely rarely seen in observations while the overall shape of the SED corresponding to the irradiated disk agrees qualitatively well with the observations (see Fig. 13 of D’Alessio et al. 1998).
3. Results
To assess how important the effect of irradiation on the disk structure is for the resulting planet population, we computed a set of synthetic planet populations with and without these effects. To do this, we used the same parameters as in the nominal model defined by Mordasini et al. (2009b) and obtained by the best possible quantitative fit to the population of giant planets detected in orbit about solar type stars. In particular, we kept the same type I migration efficiency factor (called fI) and viscosity parameter because we aimed to investigate the differences induced by irradiation. The fI factor was originally introduced because the migration rate of Tanaka et al. (2002) is known to be too high. This is owing to hypotheses made, namely, that the assumption that the disk is isothermal. The migration rate is expected to be lower for more realistic disks (non-isothermal and turbulent). Yet, an analytic migration rate for these realistic disks has not been devised until recently and the use of the Tanaka et al. (2002) migration rate reduced thanks to the fI factor was the only way to account for type I migration without loosing all planetary cores to the star.
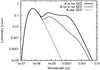 |
Fig. 2 SED of the star+disk in our model (star in dotted line; star+irradiated disk in solid line; star+ non irradiated disk in dashed line). |
Figure 3 presents the distribution of the minimum mass (msini) versus semi-major axis characterizing the synthetic planet population in the nominal case including the effects of irradiation (left panel). For comparison, the characteristics of the synthetic population obtained in the same nominal case but without irradiation (equivalent to that obtained by Mordasini et al. 2009a) is also presented (right panel). The difference is striking and illustrates the importance of the disk structure (as affected by irradiation in conjunction with our hypotheses on the migration rates) on the overall planet population able to form within the same distribution of disks as characterized by mass, metallicity, and lifetime.
The most obvious difference is that no hot planets (below 0.1 AU) are present in the synthetic irradiated population, while they were quite numerous in the population computed without irradiation effects. Furthermore, because the same number of embryos were used for seeding both populations, it is also clear that the yield in detectable planets (by radial velocity) is significantly lower in the population originating from irradiated disks. Clearly, since we expect that real disks are irradiated and that we observe numerous planets at close distances, the present discrepancy indicates that the parameters used in the nominal model must be revised to explain observations. Since we expect that because additional physics is included, these parameters will change again, we will make no attempt to fit the detected population quantitatively but rather show that a qualitative agreement is indeed possible.
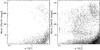 |
Fig. 3 Mass versus semi-major axis for synthetic planets. Left panel: including irradiation effects, right panel: without irradiation effects. |
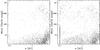 |
Fig. 4 Mass versus semi-major axis for synthetic planets, varying the type I migration efficiency factor fI, and including the irradiation effects. Left panel: fI = 10-2 (10 times larger than in Fig. 3), right panel: fI = 10-1 (100 times larger than in Fig. 3). |
Interestingly, we can recover some hot planets by increasing the type I migration rate by a factor 10 to 100 as compared to the nominal case, which corresponds to values of fI between 10-2 and 10-1 (see Fig. 4). In order to understand this, we follow in Fig. 5 the accretion and migration tracks of two growing embryos assuming identical initial conditions (starting location and time, disk mass and lifetime) but evolved in a disk with and without irradiation. For this comparison, we selected an embryo that in the non-irradiated disk grew to become a hot Neptune planet1.
As can be seen in the figure, the migration path and the masses of the two cases remain quite similar, up to 1.7 Myr. Since the masses of both planets remain small, both migrate in type I, which has been considerably reduced (by a factor f1 = 0.001 compared to the linear value) in the nominal model. The sharp change of slope of the amount of solids that are accreted at 1.3 Myr indicates for both cases that the feeding zone has essentially been depleted. However, at 1.7 Myr, the disk scale height in the disk model without irradiation becomes low enough to allow the planetary migration mode to switch to type II2.
The reason why the moment at which the migration of the planet switches from type I to type II is so important is because that the migration rate is quite different in the two regimes. The time when the core switches from one to the other will therefore impact its migration path and its accretion history. Yet, the type I migration rate is highly uncertain once one relaxes the isothermal hypothesis (see Paardekooper et al. 2010, 2011, and references therein). For now, we still rely on the fI factor used to reduce the type I migration rate compared to the linear isothermal theory. This factor was introduced because linear isothermal theory is notoriously too fast and simulations of cores migration in a turbulent disk showed a random walk that was slower than the theoretical inward migration. We plan to implement the more detailed torque formula derived by Paardekooper et al. (2010) and Paardekooper et al. (2011) in the near future (Dittkrist et al., in prep.).
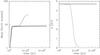 |
Fig. 5 Formation and migration tracks of two cases starting with similar initial conditions. The heavy lines are calculated including irradiation, whereas the thin lines are calculated without irradiation. In the left panel, we show the amount of accreted solids (solid lines) and the total mass of the planet (dashed line). In the right panel, we show the migration tracks. |
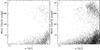 |
Fig. 6 Mass versus semi-major axis for synthetic planets. Left: model including the irradiation effects, right: test model with the non-irradiated disk structure and irradiated aspect ratio. |
To assess if the change comes from the delayed switch to type II migration, i.e. from the change in the disk aspect ratio, we ran a test simulation where we used the disk structure computed in the non-irradiated case (pressure, density, temperature...) but used the aspect ratio of an irradiated disk. From Fig. 6, we see that the pattern we obtain for the mass vs semi-major axis distribution is very close to the full irradiated case. Yet, the non-irradiated disk is cooler, and the ice line closer to the star, which leads to an increase in the solids in the studied region and an increase in cores formed. This is why we see more planets although the simulations were started with the same number of embryos. This test thus confirms that the difference comes preferentially from the aspect ratio rather than from any more complex effect of the temperature structure. This result would probably change if we used the latest formula for type I migration where torques are more sensitively depending on temperature than in the formula of Tanaka et al. (2002).
We return to the discussion of Fig. 5. Switching to type II migration results in a significant increase in the inward migration speed compared with the reduced type I speed. The inward motion of the growing embryos brings new planetesimals within its feeding zone and core growth resumes until it reaches its end value of nearly ~25 M⊕. As the core grows more massive, some nebular gas is accreted (a few M⊕) while the planet continues its inward migration. The evolution eventually stops when the disk is dissipated, leaving a hot Neptune.
If irradiation is included, the disk temperature and therefore the disk scale height remain higher, which prevents the growing planet from switching to type II migration. Since type I has been heavily suppressed, the core has to grow essentially in situ without the additional supply of planetesimals from migration in undepleted regions. As a result, the core remains small and unable to accrete a substantial amount of nebular gas. The planet forms what is generally called a cold super-Earth.
The main effect of including irradiation of the disk by the central star is therefore the modifying of migration history through the change of the disk structure, in particular the disk scale height. The change in the migration history then has a strong impact on the outcome of the planet formation because in our model the migration rates strongly differ between type I and type II. As a result, the conjunction of accounting for irradiation and damping the type I migration rate is responsible for the substantial change in the evolution of the growing planet. This implies that the criterion used to define the migration mode is equally important. In the nominal model as applied by Mordasini et al. (2009b) which we used above, migration type was switched from type I to type II once the Hill radius of the growing planet exceeds the disk scale height. A more precise determination of the conditions leading to a switch in migration mode have been carried out by Crida et al. (2006). The importance of viscosity was already shown by Lin & Papaloizou (1986), but the new expression handles more realistic conditions. Using a set of numerical simulations, these authors have studied under which conditions a planet could open a gap and migrate to type II. They have found that these conditions depend not only on the disk scale height but also on the Reynolds number in the gas disk in the vicinity of the planet. While the first condition can be understood in terms of the gas filling the gap from above, the second occurs because a higher viscosity will lead to a filling of the gap from the sides.
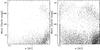 |
Fig. 7 Same as Fig. 4, but with the gap opening criterion derived by Crida et al. (2006). |
A fitting formula derived from the numerical calculations gives the following condition for gap opening:  (10)where
  is the Reynolds number at the location of the planet (corresponding quantities have a P subscript).
To illustrate the importance of the definition of the migration switch, we computed again full synthetic planet populations but using the switch defined by Crida et al. (2006) and given above. The resulting populations are shown in Fig. 7. These are to be compared with those shown in Fig. 4, which were computed using the nominal switch (scale height condition only).
The resulting populations obtained using this new gap opening criterion are very similar to those obtained using the standard gap opening criterion, as one can see when comparing Fig. 7 left to Fig. 4 left, and then Fig. 7 right to Fig. 4 right. The reason for this is that irradiation prevents the cooling of the disk, and therefore the decrease of the disk thickness. As a consequence, the first term in the above equation is always the dominant one, and determines the gap opening. The resulting gap opening criterion, namely RHill > 3/4Hdisk is therefore similar, except for the numerical factor, to the one used before (RHill > Hdisk), and the final planet populations are similar. Therefore, we conclude that the effect of irradiation strongly depend on the migration model used. Of particular importance in this respect is the transition mass when the planet changes its migration mode from type I to type II. The higher the difference of migration rates between these two regimes, the larger the effect of irradiation.
4. Conclusion
We have extended the core accretion model of Alibert et al. (2005) by including irradiation by the central star on the top of the already computed viscous heating. We validated our disk model against the model by D’Alessio et al. (1998). We restricted ourselves to the equilibrium flaring index of 9/7 and studied only one extreme situation where the disk is irradiated at all radii. In reality, we expect that parts of the disk may be self-shadowed. Already, the inner edge of the disk is expected to be puffed up because it is directly illuminated by the star and, thus, casts a shadow on the disk nearby. There may be other sources of self-shadowing. Another limitation of the model is the use of gray opacities. Dullemond et al. (2002) showed that using gray opacities is responsible for the systematic offset of the midplane temperature compared to full radiative transfer simulations. Below a given radius, the temperature is found to be warmer and the reverse is found beyond. Dullemond et al. (2002) explain it by a “leakage” of radiation out of the disk at long wavelengths that would be compensated for by a downward diffusive flux at shorter wavelength. Yet, our goal so far was to use a relevant disk structure such as that computed by D’Alessio et al. (1998), which also relies on gray opacities. This paper is the first step in a series of improvements of the disk model where we will self-consistently compute the flaring index and account for self-shadowed regions of the disk, if there are any. Another improvement will be the use of non gray opacities.
We have shown that, under these conditions, because the outer disk is warmer than in the previous models, the transition from type I to type II migration occurs later (once the core is more massive). This happens because the warmer outer disk is thicker, which makes it more difficult for the planet to open a gap and reach type II migration.
Type I migration as described in the standard theory of a laminar isothermal disk is known to be too fast. Alibert et al. (2005) therefore used a reducing factor on the order of 10-3–10-2 together with the migration rates devised by Tanaka et al. (2002) under those hypotheses and obtained a good match between their planet population synthesis and observations of planets (Mordasini et al. 2009b). Now, with the improved disk structure, we can increase this factor to 10-1 giving less drastic constraints on the necessary slow-down of type I migration. Note, however, that the strong effect of irradiation is largely a result of both using the classical gap opening criterion, and using highly reduced type I migration rates. Recent calculations (Paardekooper et al. 2010, 2011) have shown that type I migration is indeed more complex than previously envisioned (Tanaka et al. 2002), and strongly depends on the local properties of the protoplanetary disk, in particular its cooling properties. Including these more complex type I migration rates, combined with the gap opening criterion from Crida et al. (2006), will likely result in very different formation tracks. In this context, the fI factor will not appear in its present form anymore. We give the new value of 10-1 to point out that our model still accounts for hot Jupiters. The new calculations with new type I migration rates and the new gap opening criterion are presently developed and will probably modify (increase or decrease) the effect of irradiation on resulting planets (Dittkrist et al., in prep.). We are therefore getting closer to a fully self-consistent and complete model for planet formation.
Planets whose formation track belongs to the “horizontal branch” case, see Mordasini et al. (2009a).
In these models, the planet switches to type II migration when its Roche radius exceeds the disk density scale height, see Mordasini et al. (2009a,b) for a discussion of this criterion.
References
- Alibert, Y., Mordasini, C., Benz, W., & Winisdoerffer, C. 2005, A&A, 434, 343 [NASA ADS] [CrossRef] [EDP Sciences] [Google Scholar]
- Alibert, Y., Pont, F., Baraffe, I., et al. 2009, A&A, 506, 391 [NASA ADS] [CrossRef] [EDP Sciences] [Google Scholar]
- Alibert, Y., Mordasini, C., & Benz, W. 2011, A&A, 526, A63 [NASA ADS] [CrossRef] [EDP Sciences] [Google Scholar]
- Baruteau, C., & Masset, F. 2008a, ApJ, 672, 1054 [NASA ADS] [CrossRef] [Google Scholar]
- Baruteau, C., & Masset, F. 2008b, ApJ, 678, 483 [NASA ADS] [CrossRef] [Google Scholar]
- Bell, K. R., & Lin, D. N. C. 1994, ApJ, 427, 987 [NASA ADS] [CrossRef] [Google Scholar]
- Chiang, E. I., & Goldreich, P. 1997, ApJ, 490, 368 [NASA ADS] [CrossRef] [Google Scholar]
- Crida, A., Morbidelli, A., & Masset, F. 2006, Icarus, 181, 587 [Google Scholar]
- D’Alessio, P., Canto, J., Calvet, N., & Lizano, S. 1998, ApJ, 500, 411 [NASA ADS] [CrossRef] [Google Scholar]
- Duchêne, G., McCabe, C., Ghez, A. M., & Macintosh, B. A. 2004, ApJ, 606, 969 [NASA ADS] [CrossRef] [Google Scholar]
- Dullemond, C. P., van Zadelhoff, G. J., & Natta, A. 2002, A&A, 389, 464 [NASA ADS] [CrossRef] [EDP Sciences] [Google Scholar]
- Hueso, R., & Guillot, T. 2005, A&A, 442, 703 [NASA ADS] [CrossRef] [EDP Sciences] [Google Scholar]
- Kley, W., & Crida, A. 2008, A&A, 487, L9 [NASA ADS] [CrossRef] [EDP Sciences] [Google Scholar]
- Kley, W., Bitsch, B., & Klahr, H. 2009, A&A, 506, 971 [NASA ADS] [CrossRef] [EDP Sciences] [Google Scholar]
- Lin, D. N. C., & Papaloizou, J. 1986, ApJ, 309, 846 [NASA ADS] [CrossRef] [Google Scholar]
- Mordasini, C., Alibert, Y., & Benz, W. 2009a, A&A, 501, 1139 [NASA ADS] [CrossRef] [EDP Sciences] [Google Scholar]
- Mordasini, C., Alibert, Y., Benz, W., & Naef, D. 2009b, A&A, 501, 1161 [NASA ADS] [CrossRef] [EDP Sciences] [Google Scholar]
- Paardekooper, S.-J., & Mellema, G. 2006, A&A, 459, L17 [NASA ADS] [CrossRef] [EDP Sciences] [Google Scholar]
- Paardekooper, S.-J., & Mellema, G. 2008, A&A, 478, 245 [NASA ADS] [CrossRef] [EDP Sciences] [Google Scholar]
- Paardekooper, S., Baruteau, C., Crida, A., & Kley, W. 2010, MNRAS, 401, 1950 [NASA ADS] [CrossRef] [Google Scholar]
- Paardekooper, S.-J., Baruteau, C., & Kley, W. 2011, MNRAS, 410, 293 [NASA ADS] [CrossRef] [Google Scholar]
- Papaloizou, J. C. B., Nelson, R. P., Kley, W., Masset, F. S., & Artymowicz, P. 2007, in Protostars and Planets V, ed. B. Reipurth, D. Jewitt, & K. Keil, 655 [Google Scholar]
- Papaloizou, J. C. B., & Terquem, C. 1999, ApJ, 521, 823 [NASA ADS] [CrossRef] [Google Scholar]
- Pinte, C., Padgett, D. L., Ménard, F., et al. 2008, A&A, 489, 633 [NASA ADS] [CrossRef] [EDP Sciences] [Google Scholar]
- Pollack, J. B., Hubickyj, O., Bodenheimer, P., et al. 1996, Icarus, 124, 62 [NASA ADS] [CrossRef] [Google Scholar]
- Shakura, N. I., & Sunyaev, R. A. 1973, A&A, 24, 337 [NASA ADS] [Google Scholar]
- Tanaka, H., Takeuchi, T., & Ward, W. R. 2002, ApJ, 565, 1257 [NASA ADS] [CrossRef] [Google Scholar]
All Figures
|
Fig. 1 Top row left: miplane temperature for the disk with irradiation (solid line), without irradiation (dashed line) and in the model by D’Alessio et al. (1998); (dotted line). Right: comparison of our model with irradiation (B) and that by D’Alessio et al. (1998) (D): miplane temperature (ours: solid line, D’Alessio: dashed line), photospheric temperature (dotted line, D’Alessio: short dotted line). Bottom row left: surface density (ours: solid line, D’Alessio: dashed line). Right: pressure scale height (ours: solid line, D’Alessio: dashed line, fit with |
| In the text | |
|
Fig. 2 SED of the star+disk in our model (star in dotted line; star+irradiated disk in solid line; star+ non irradiated disk in dashed line). |
| In the text | |
|
Fig. 3 Mass versus semi-major axis for synthetic planets. Left panel: including irradiation effects, right panel: without irradiation effects. |
| In the text | |
|
Fig. 4 Mass versus semi-major axis for synthetic planets, varying the type I migration efficiency factor fI, and including the irradiation effects. Left panel: fI = 10-2 (10 times larger than in Fig. 3), right panel: fI = 10-1 (100 times larger than in Fig. 3). |
| In the text | |
|
Fig. 5 Formation and migration tracks of two cases starting with similar initial conditions. The heavy lines are calculated including irradiation, whereas the thin lines are calculated without irradiation. In the left panel, we show the amount of accreted solids (solid lines) and the total mass of the planet (dashed line). In the right panel, we show the migration tracks. |
| In the text | |
|
Fig. 6 Mass versus semi-major axis for synthetic planets. Left: model including the irradiation effects, right: test model with the non-irradiated disk structure and irradiated aspect ratio. |
| In the text | |
|
Fig. 7 Same as Fig. 4, but with the gap opening criterion derived by Crida et al. (2006). |
| In the text | |
Current usage metrics show cumulative count of Article Views (full-text article views including HTML views, PDF and ePub downloads, according to the available data) and Abstracts Views on Vision4Press platform.
Data correspond to usage on the plateform after 2015. The current usage metrics is available 48-96 hours after online publication and is updated daily on week days.
Initial download of the metrics may take a while.