Fig. 1
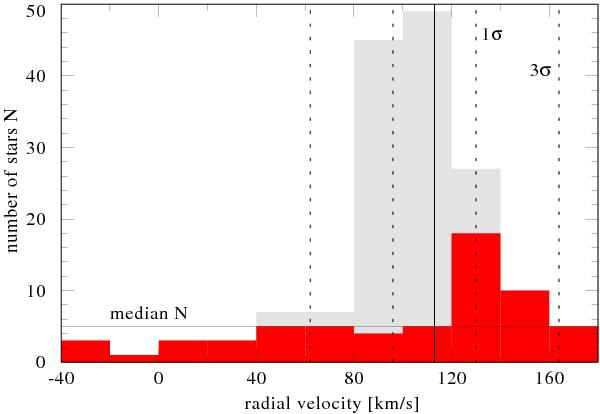
Histogram of the distribution of RVs of all LHO stars (light gray). Overplotted is the distribution for the late-type KM stars (dark/red). Solid and dashed lines indicate the cluster RV of 113 km s-1 and the 1σ and 3σ intervals, respectively.
Current usage metrics show cumulative count of Article Views (full-text article views including HTML views, PDF and ePub downloads, according to the available data) and Abstracts Views on Vision4Press platform.
Data correspond to usage on the plateform after 2015. The current usage metrics is available 48-96 hours after online publication and is updated daily on week days.
Initial download of the metrics may take a while.