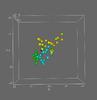
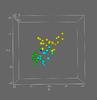
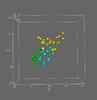
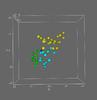
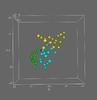
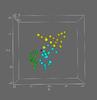
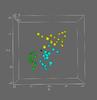
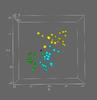
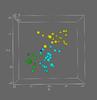
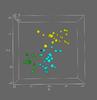
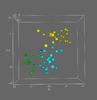
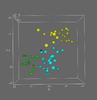
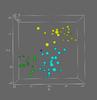
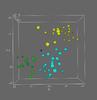
Fig. A.1
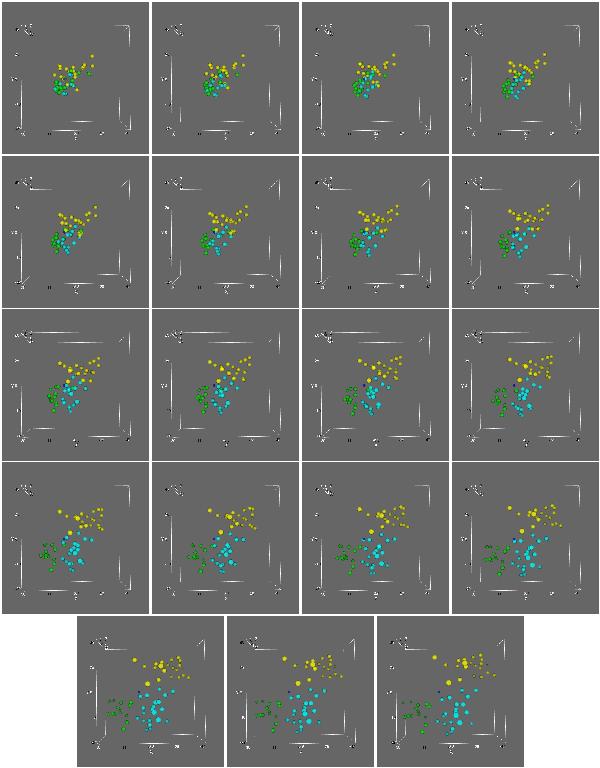
3D view of the OMC-1 outflow from the expansion center ≤ 720 years ago to the present time. The blue dot is the computed expansion center (αJ2000 = 05h35m14 50, δJ2000 = −05°22′23
 00). Yellow, green and turquoise points show the disposition of the Peak 1, Peak 2 and Region B objects through time. The snapshots are at intervals of 40 years. xy is the plane of the sky. Notwithstanding the magnetic deflection model introduced in Sect. 5, we have for simplicity and to avoid model dependence used rectilinear trajectories in this and all other relevant figures.


Current usage metrics show cumulative count of Article Views (full-text article views including HTML views, PDF and ePub downloads, according to the available data) and Abstracts Views on Vision4Press platform.
Data correspond to usage on the plateform after 2015. The current usage metrics is available 48-96 hours after online publication and is updated daily on week days.
Initial download of the metrics may take a while.