Fig. 5
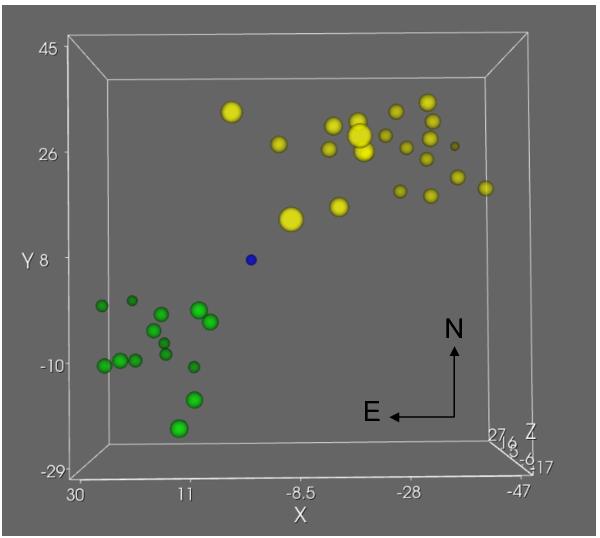
Disposition of Peak 1 and Peak 2 objects in yellow and green respectively at the present epoch seen in the line-of-sight. Thirty-six features are displayed in this figure. This image is a reconstruction from Fig. 4 after 720 years. The dark blue dot is the computed expansion center, as earlier. Larger and brighter objects are closer. Units are in arcseconds.
Current usage metrics show cumulative count of Article Views (full-text article views including HTML views, PDF and ePub downloads, according to the available data) and Abstracts Views on Vision4Press platform.
Data correspond to usage on the plateform after 2015. The current usage metrics is available 48-96 hours after online publication and is updated daily on week days.
Initial download of the metrics may take a while.