Fig. 4
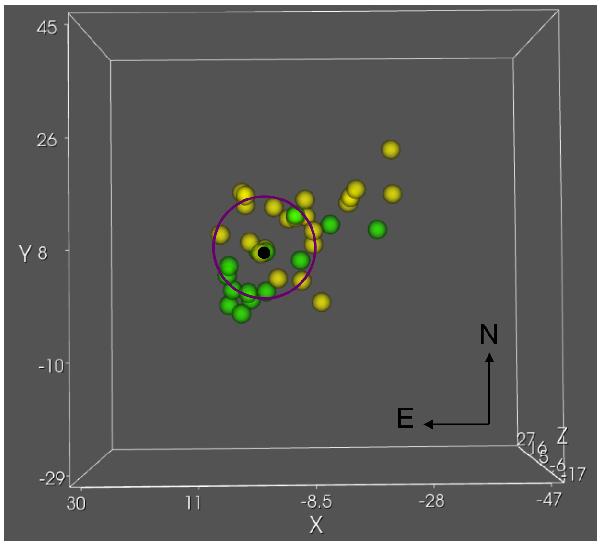
Disposition of the Peak 1 and Peak 2 objects in yellow and green, respectively at the epoch time zero of the explosion seen in the line-of-sight (i.e. perpendicular to the plane of the sky xy). Thirty-six features are displayed in this figure. The dark dot is the computed expansion center (Nissen 2008; Bally et al. 2011). The ring-like structure which forms when proper motions are run backward in time is highlighted in violet. This structure is the starting point for the 3D-simulations illustrated in subsequent figures. Units are in arcseconds.
Current usage metrics show cumulative count of Article Views (full-text article views including HTML views, PDF and ePub downloads, according to the available data) and Abstracts Views on Vision4Press platform.
Data correspond to usage on the plateform after 2015. The current usage metrics is available 48-96 hours after online publication and is updated daily on week days.
Initial download of the metrics may take a while.