Fig. 2
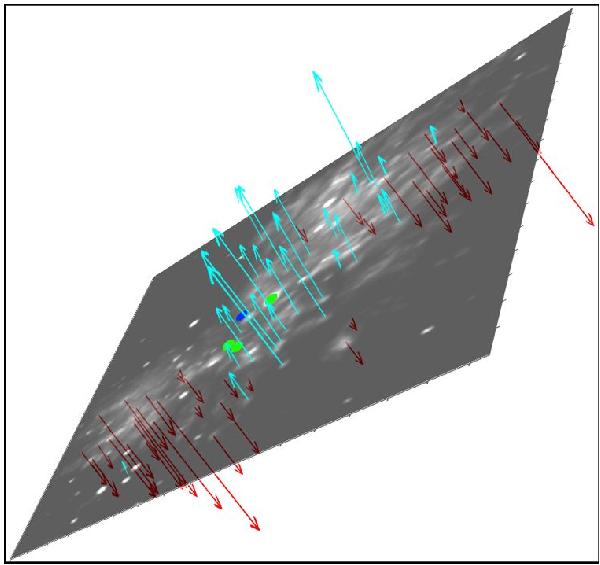
Radial velocities of 71 individual features in the OMC-1 outflow for the same 1′ × 1′ field of view as in Fig. 1. The orientation of the image – with the Earth to the top left – illustrates the radial velocities associated with each of the objects for which proper motions are shown in Fig. 1. Blue and red-shifted emissions are shown as blue and red arrows, respectively. The length of the longest arrows corresponds to 50 km s-1 in the local standard of rest.
Current usage metrics show cumulative count of Article Views (full-text article views including HTML views, PDF and ePub downloads, according to the available data) and Abstracts Views on Vision4Press platform.
Data correspond to usage on the plateform after 2015. The current usage metrics is available 48-96 hours after online publication and is updated daily on week days.
Initial download of the metrics may take a while.