Fig. 1
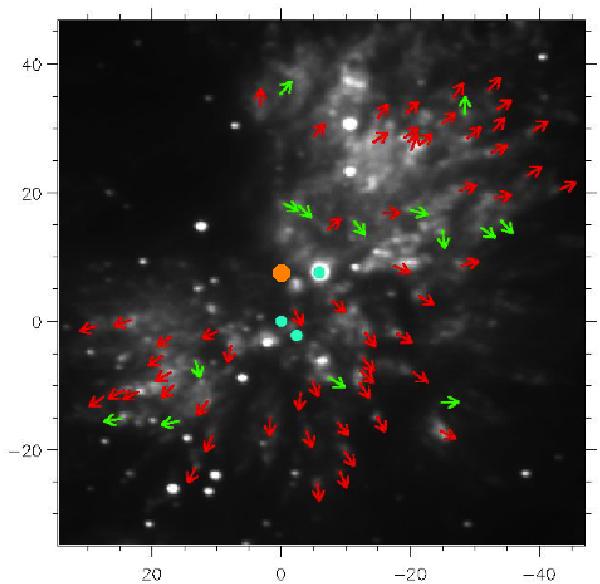
Field of view covering the inner 0.1 pc (1′ × 1′) of OMC-1 in the present work. The grey-scale shows the emission line v = 1−0 S(1) of H2 at 2.121 μm (observations carried out with the 3.6 m CFHT telescope using the GriF instrument, see Gustafsson et al. 2003, 2006; Nissen et al. 2007). Green and red arrows, representative of the 71 data for which there exist both proper motions and radial velocities, show the measured position angles. Those arrows which point with a deviation of less than 30° from a computed center of expansion based on all 194 proper motion data (Cunningham 2006; Bally et al. 2011) (the orange dot – see text) are shown in red and those that show a deviation >30° are in green. Positions of the BN object (αJ2000 = 05h35m14 1094, δJ2000 = −05°22′22
 724), the source n (αJ2000 = 05h35m143571, δJ2000 = −05°22′32719) and the radio source I (αJ2000 = 05h35m145141, δJ2000 = −05°22′30575) (Goddi et al. 2011b) – turquoise dots – are indicated. The coordinates of (0, 0) are those of the radio source I. Units are arcseconds, where 1″ = 414 ± 7 AU (Menten et al. 2007; Kim et al. 2008).
Current usage metrics show cumulative count of Article Views (full-text article views including HTML views, PDF and ePub downloads, according to the available data) and Abstracts Views on Vision4Press platform.
Data correspond to usage on the plateform after 2015. The current usage metrics is available 48-96 hours after online publication and is updated daily on week days.
Initial download of the metrics may take a while.