Fig. 6
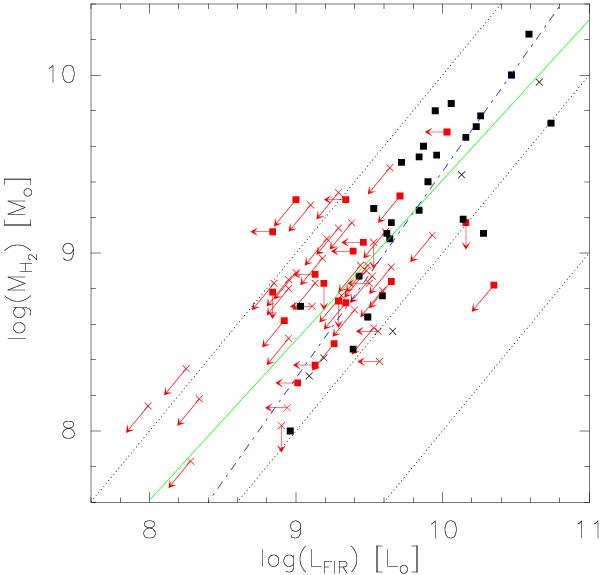
MH2 vs. LFIR for late-type (T ≥ 1, squares) and early-type (E+S0, crosses) galaxies. The green line corresponds to the bisector fit found for HCGs galaxies, while the blue dashed-dotted line corresponds to the bisector fit found for the AMIGA isolated galaxies from Lisenfeld et al. (2011). The fits are detailed in Table 4. The dotted black lines correspond to the LFIR/MH2 ratios 1 (left), 10 (middle), and 100 (right) L⊙/M⊙. Black symbols denote detections and red symbols upper limits.
Current usage metrics show cumulative count of Article Views (full-text article views including HTML views, PDF and ePub downloads, according to the available data) and Abstracts Views on Vision4Press platform.
Data correspond to usage on the plateform after 2015. The current usage metrics is available 48-96 hours after online publication and is updated daily on week days.
Initial download of the metrics may take a while.