Fig. 4
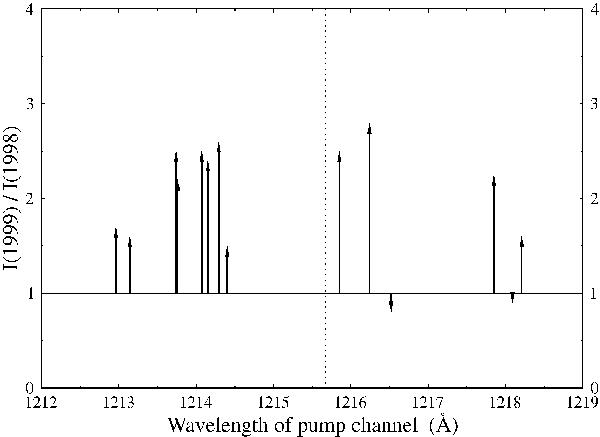
Observed intensity changes of the Fe ii fluorescence lines between 1998 and 1999. Each arrow, placed at the wavelength of the appropriate pumping channel, represents the intensity ratio of I/I of lines originating from one of the pumped levels. Arrows pointing upward indicate an increase; downward a decrease. The dashed vertical line marks the rest wavelength of H Lyα.
Current usage metrics show cumulative count of Article Views (full-text article views including HTML views, PDF and ePub downloads, according to the available data) and Abstracts Views on Vision4Press platform.
Data correspond to usage on the plateform after 2015. The current usage metrics is available 48-96 hours after online publication and is updated daily on week days.
Initial download of the metrics may take a while.