Fig. 3
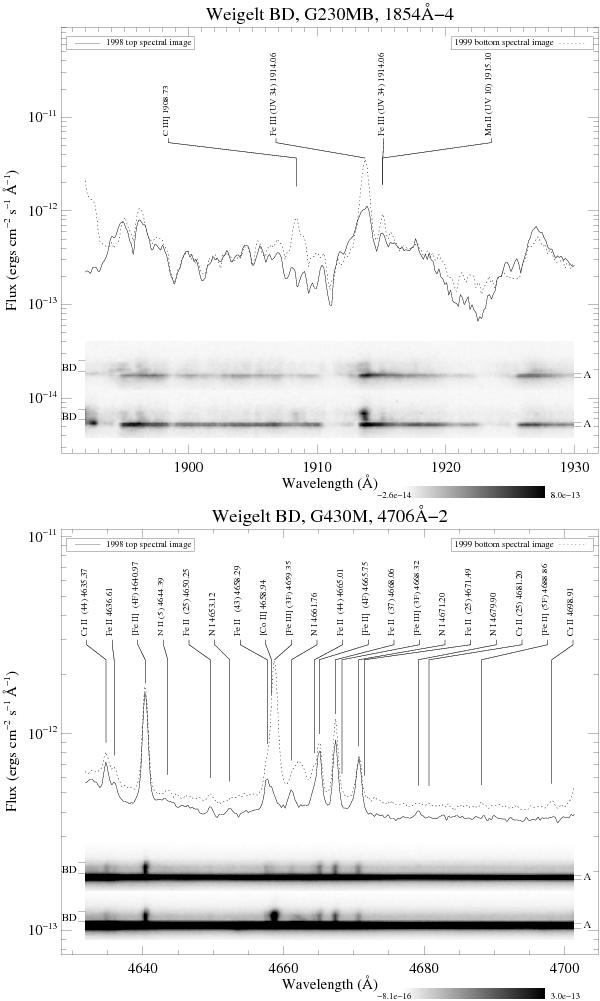
Two examples of spectro-images (spatially-resolved spectra) of η Car, Weigelt B and Weigelt D. Top plot: spectral region from 1892 to 1930 Å recorded during March 1998 and February 1999. The dark streak, labeled “A”, is the spectrum of η Car. Immediately above, labeled “BD”, are the two Weigelt blobs. In the February 1999 (high state) spectrum, a narrow emission of Fe iii 1914.06 Å is prominent, but is absent in the February 1998 spectrum. Much faint continuum extends from the stellar position across the blobs. Velocity shifting absorptions can be seen in both spectra. Absorptions are much more noticeable in the March 1998 (low-state) spectrum. The increase in continuum by Feb. 1999 (high state) is real. Bottom plot: spectral region from 4632 to 4702 Å recorded in the same HST/STIS visits. Narrow emission lines are visible in both spectra with no intervening absorptions. The [Fe iii] 4659.35 Å line is present in the February 1999 (high) spectrum but absent in the March 1998 spectrum. A tilted emission feature at 4662 Å originates from the same line as the red-shifted component from an arcuate-shaped surface associated with the interacting wind cavity (Gull et al. 2009).
Current usage metrics show cumulative count of Article Views (full-text article views including HTML views, PDF and ePub downloads, according to the available data) and Abstracts Views on Vision4Press platform.
Data correspond to usage on the plateform after 2015. The current usage metrics is available 48-96 hours after online publication and is updated daily on week days.
Initial download of the metrics may take a while.