Fig. 9
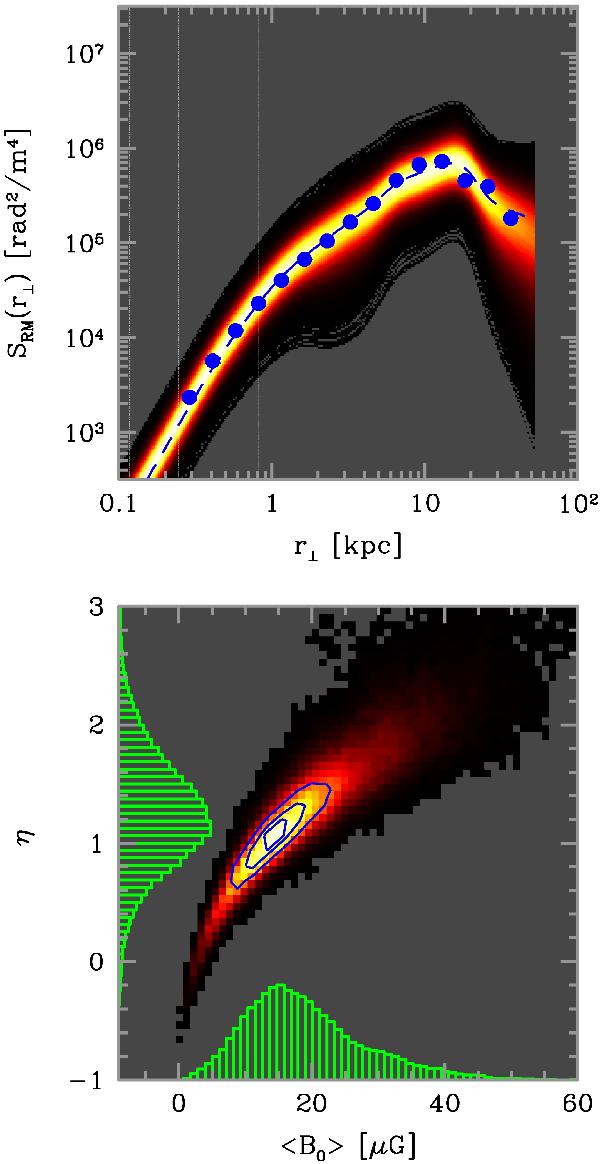
Bayesian 3-dimensional analysis of the RM structure function for the model with Λmax = 35 kpc. Top panel: the dots represent the data (error bars are comparable to the size of the symbols). The shaded area represents the population of synthetic RM structure functions from the posterior distribution. The dashed line corresponds to the most probable value for the model parameters (see text). Bottom panel: one-dimensional (histograms) and two-dimensional (colors and contours) marginalizations of the posterior for the model parameters. The contours are traced at 0.9, 0.75, and 0.5 of the peak value.
Current usage metrics show cumulative count of Article Views (full-text article views including HTML views, PDF and ePub downloads, according to the available data) and Abstracts Views on Vision4Press platform.
Data correspond to usage on the plateform after 2015. The current usage metrics is available 48-96 hours after online publication and is updated daily on week days.
Initial download of the metrics may take a while.