Fig. 8
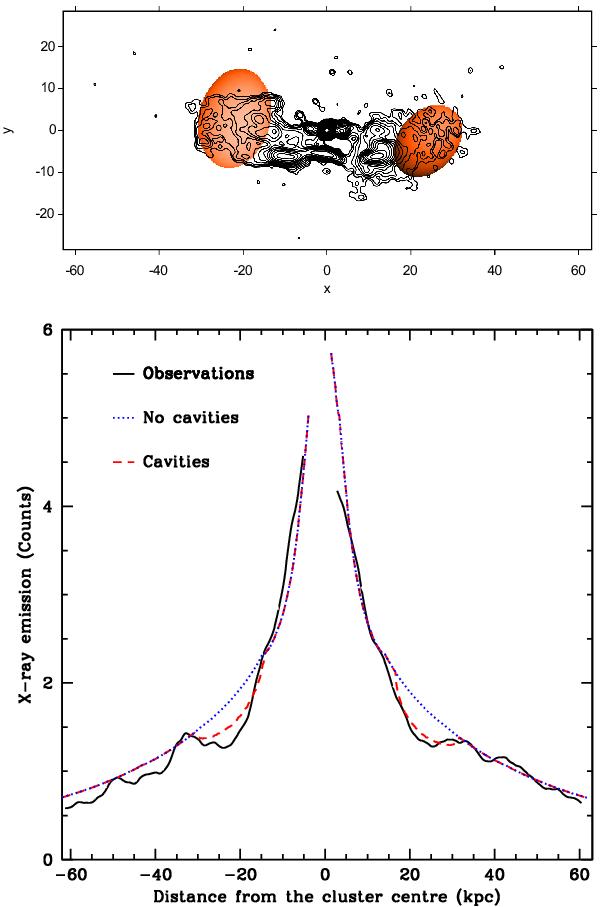
Top panel: X-ray cavity model. The darker region indicates the location where the thermal gas has been subtracted from the double β-model. Bottom panel: horizontal slice passing through the X-ray cavities at the cluster center. Continuous line represents the observations from the Chandra image, dashed line simulations with cavities, dotted line simulations without cavities.
Current usage metrics show cumulative count of Article Views (full-text article views including HTML views, PDF and ePub downloads, according to the available data) and Abstracts Views on Vision4Press platform.
Data correspond to usage on the plateform after 2015. The current usage metrics is available 48-96 hours after online publication and is updated daily on week days.
Initial download of the metrics may take a while.