Fig. 3
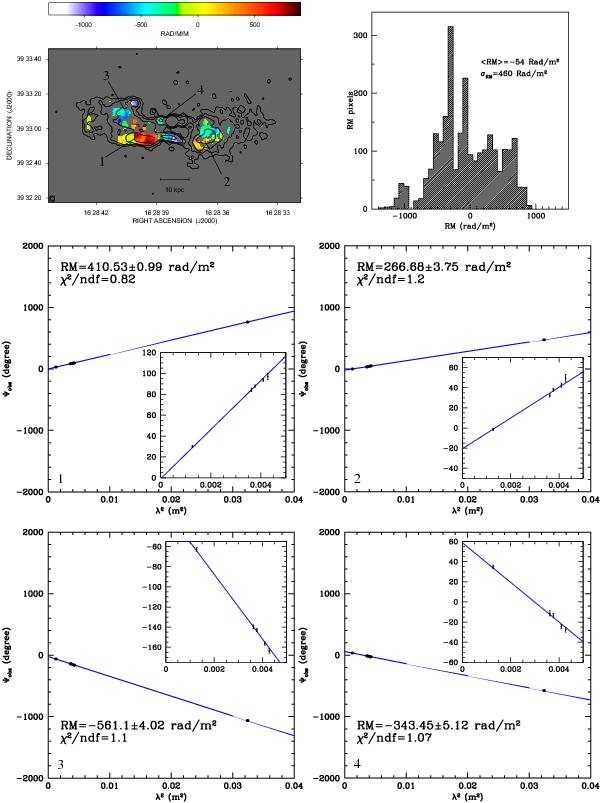
Top left: total intensity radio contours of 3C 338 at 8415 MHz overlaid on the RM image. The angular resolution is 2.5″ × 2.5″. Contour levels are drawn at: 0.06, 0.12, 0.24, and 0.96 mJy/beam. Top right: the histogram of the RM values. Bottom: sample plots of the observed position angle versus the squared wavelength at different source locations. The inset is a zoom of the observed polarization angle corresponding to frequencies between 4585 and 8415 MHz.
Current usage metrics show cumulative count of Article Views (full-text article views including HTML views, PDF and ePub downloads, according to the available data) and Abstracts Views on Vision4Press platform.
Data correspond to usage on the plateform after 2015. The current usage metrics is available 48-96 hours after online publication and is updated daily on week days.
Initial download of the metrics may take a while.