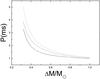
Fig. 6
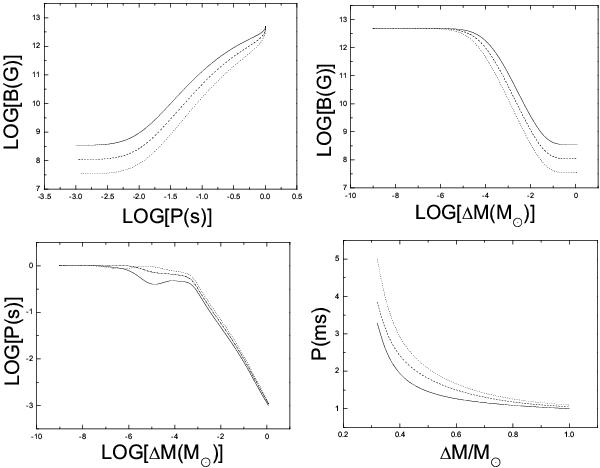
B and P evolution in the recycling process. The upper left panel shows the joint evolution of B and P. The upper right and lower left panels are their evolution as a function of accreted mass ΔM. The solid, dashed, and dotted lines are the evolutionary tracks with the accretion rate of 1018 g/s, 1017 g/s, and 1016 g/s, respectively. The initial B and P are taken as B0 = 5 × 10¹² G and P0 = 1 s. The lower right panel is a zoom-in view of the lower left panel in a linear scale for spin periods shorter than 5 ms.
Current usage metrics show cumulative count of Article Views (full-text article views including HTML views, PDF and ePub downloads, according to the available data) and Abstracts Views on Vision4Press platform.
Data correspond to usage on the plateform after 2015. The current usage metrics is available 48-96 hours after online publication and is updated daily on week days.
Initial download of the metrics may take a while.