Fig. 5
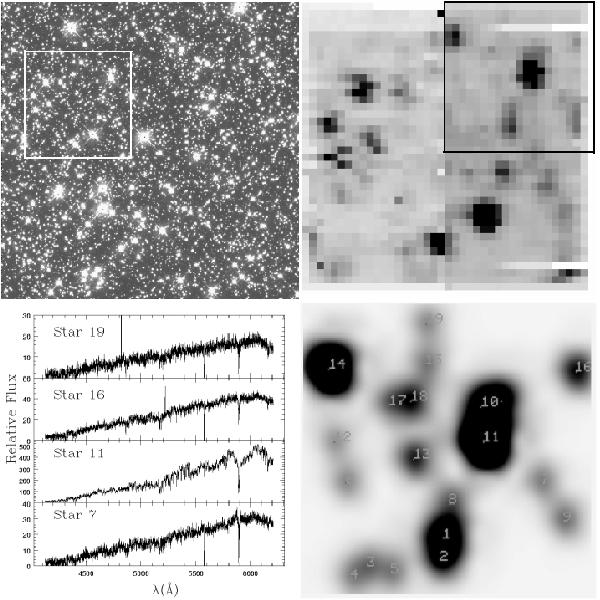
Steps during the process to build a star spectrum from the spectral cube. The top left figure corresponds to one of our observations with HST WF2 in Baade’s window, the white square corresponds to the area covered by one of the VIMOS IFU images (top right). In the IFU field the first quadrant is enclosed, its respective convolved image produced during the deconvolution process to check the detection of stars in the first quadrant appear at the bottom right. Finally some examples of the spectra extracted by this process are shown at the bottom left.
Current usage metrics show cumulative count of Article Views (full-text article views including HTML views, PDF and ePub downloads, according to the available data) and Abstracts Views on Vision4Press platform.
Data correspond to usage on the plateform after 2015. The current usage metrics is available 48-96 hours after online publication and is updated daily on week days.
Initial download of the metrics may take a while.