Free Access
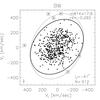
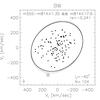
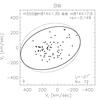
Fig. 15
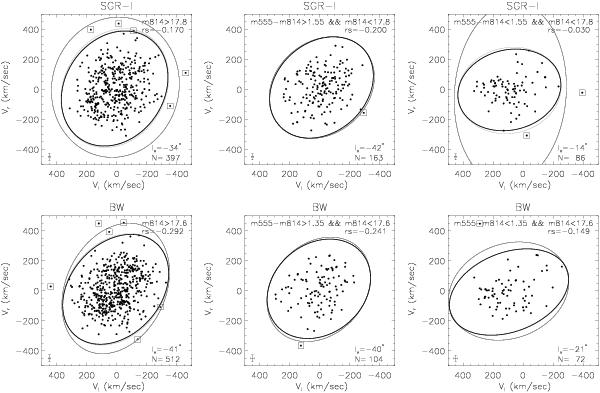
Baade’s Window and Sagittarius-I velocity ellipsoids for radial velocities (Vr) and transverse proper motion (Vl), divided by population. The region selected is indicated in each plot, and follows the same limits shown in Fig. 12, which correspond (from left to right) to turn-off, RGB and blue-end of the main sequence.
This figure is made of several images, please see below:
Current usage metrics show cumulative count of Article Views (full-text article views including HTML views, PDF and ePub downloads, according to the available data) and Abstracts Views on Vision4Press platform.
Data correspond to usage on the plateform after 2015. The current usage metrics is available 48-96 hours after online publication and is updated daily on week days.
Initial download of the metrics may take a while.