Fig. 12
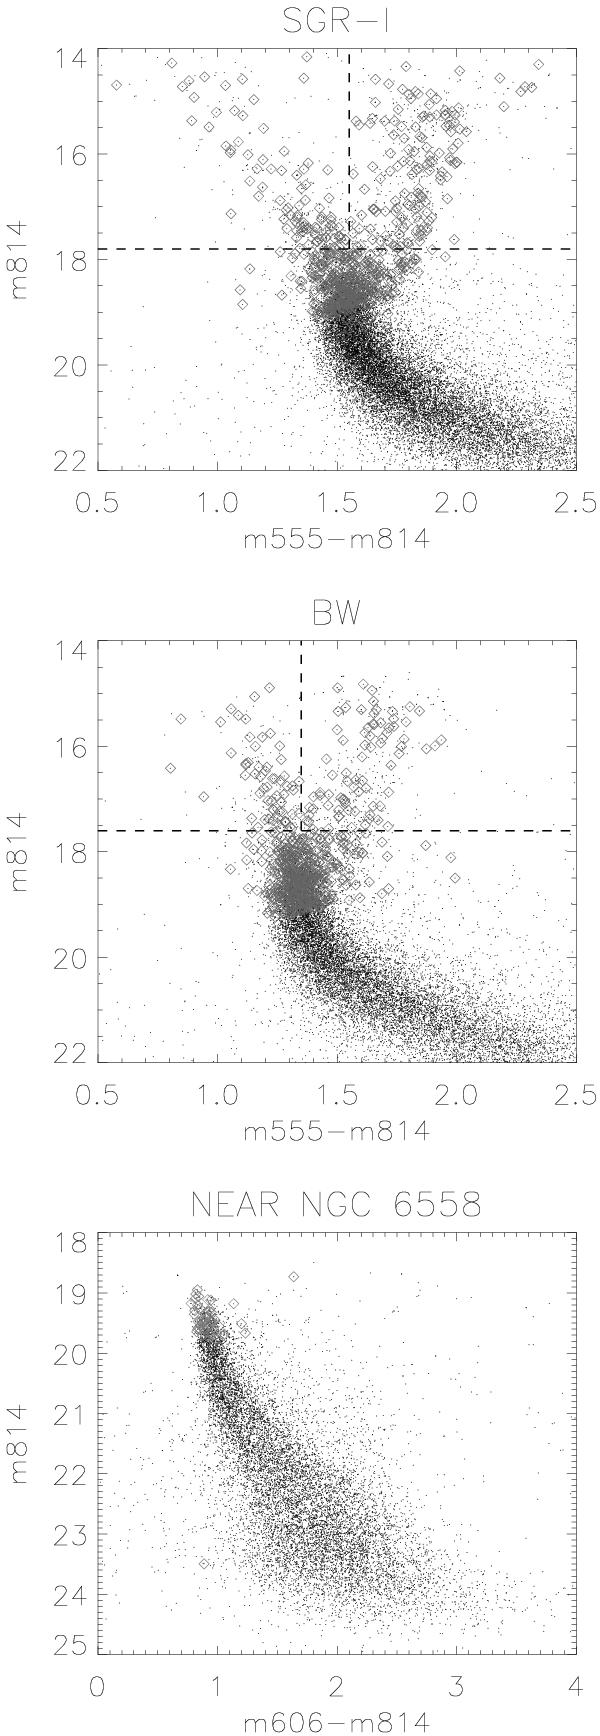
CMD for the three minor-axis fields. IFU detections (open squares) have been highlighted over HST detections in each field. Dashed lines in Sagittarius-I and Baade’s Window fields represent the limits of the different regions in which we have divided each CMD, blue-end of the main sequence (blue-MS; top left), red giant branch (RGB; top right) and turn-off (bottom). Consequently, we have excluded the blue-end of the main sequence from the bulge analysis due to its proper motions; these are consistent with a population dominated by foreground stars rotating in front of the bulge.
Current usage metrics show cumulative count of Article Views (full-text article views including HTML views, PDF and ePub downloads, according to the available data) and Abstracts Views on Vision4Press platform.
Data correspond to usage on the plateform after 2015. The current usage metrics is available 48-96 hours after online publication and is updated daily on week days.
Initial download of the metrics may take a while.