Fig. 8
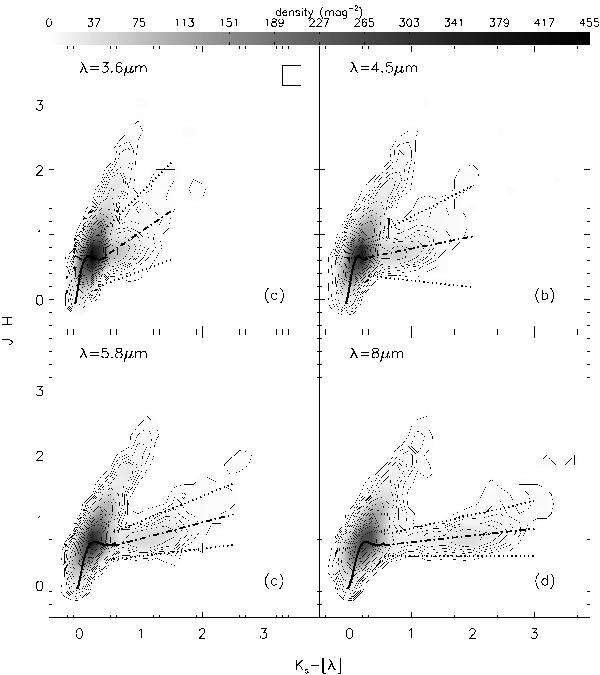
NIR+IRAC colour–colour Nyquist-sampled density diagrams for sources in the IRAC sample. The beam size is 0.3 × 0.3 mag and is represented by a pixel in the upper right corner of panel a). The contours are the same for each diagram and correspond to 3, 6.5, 10, 15, 20, 30, 50, 75, 100, 125, 150, 175, 200, 250, 300, and 400 sources mag-2. The solid black curve corresponds to the main sequence of the Pleiades (see Lada et al. 2006). The dashed-dotted lines correspond to the loci of disked sources for each colour–colour space (see Table 3). The dotted lines correspond to 3-σ (5-σ) error in the disk loci for the upper (lower) two panels.
Current usage metrics show cumulative count of Article Views (full-text article views including HTML views, PDF and ePub downloads, according to the available data) and Abstracts Views on Vision4Press platform.
Data correspond to usage on the plateform after 2015. The current usage metrics is available 48-96 hours after online publication and is updated daily on week days.
Initial download of the metrics may take a while.