Fig. A.1
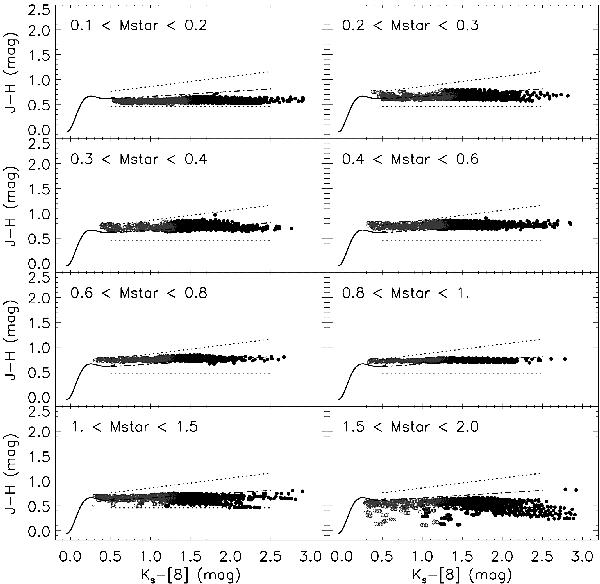
Color–color diagrams using models from Robitaille et al. (2006) for disked sources with inclinations smaller than 75° for different ranges of stellar masses (M⊙). The black solid line represents the Pleiades main sequence, the dot-dashed line corresponds to the disk locus, and the dotted lines represent the 5-σ error loci as determined by the observations of NGC 2264 (see Sect. 3.3, Fig. 8 and Table 3). The black dots represent sources with optically thick disks, and the grey circles represent sources with anaemic disks.
Current usage metrics show cumulative count of Article Views (full-text article views including HTML views, PDF and ePub downloads, according to the available data) and Abstracts Views on Vision4Press platform.
Data correspond to usage on the plateform after 2015. The current usage metrics is available 48-96 hours after online publication and is updated daily on week days.
Initial download of the metrics may take a while.