Fig. 5
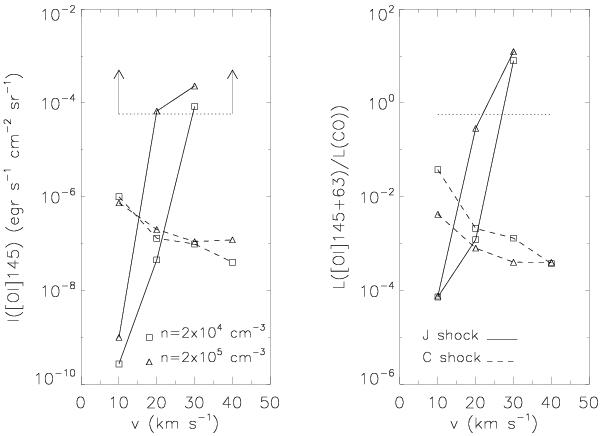
Comparison between observed value (horizontal dotted line) and theoretical values for the Flower & Pineau des Forêts (2010) shock models (connected symbols) of the [O i]145 μm surface brightness (left panel) and the cooling ratio L([O i]145+63)/L(CO) (right panel), as a function of shock speed. Solid lines refer to J-shocks and dashed lines to C-shocks; squares refer to pre-shock density n = 2 × 104 cm-3 and triangles to n = 2 × 105 cm-3.
Current usage metrics show cumulative count of Article Views (full-text article views including HTML views, PDF and ePub downloads, according to the available data) and Abstracts Views on Vision4Press platform.
Data correspond to usage on the plateform after 2015. The current usage metrics is available 48-96 hours after online publication and is updated daily on week days.
Initial download of the metrics may take a while.