Fig. 9
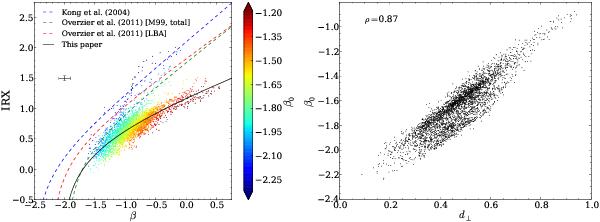
Left: same as Fig. 5 with the colour of each data point corresponding to the intrinsic UV slope β0, ranging from −2.32 to −1.19. Data points lower than −2.32 (resp. higher than −1.19) are shown in dark blue (resp. dark red) allowing a wider dynamic range for the bulk of the data points. Right: intrinsic UV slope β0 versus the perpendicular distance d⊥. The Spearman correlation coefficient is ρ = 0.87.
Current usage metrics show cumulative count of Article Views (full-text article views including HTML views, PDF and ePub downloads, according to the available data) and Abstracts Views on Vision4Press platform.
Data correspond to usage on the plateform after 2015. The current usage metrics is available 48-96 hours after online publication and is updated daily on week days.
Initial download of the metrics may take a while.