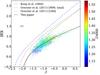
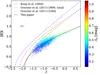
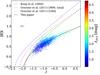
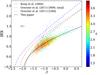
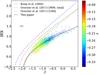
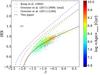
Fig. 5
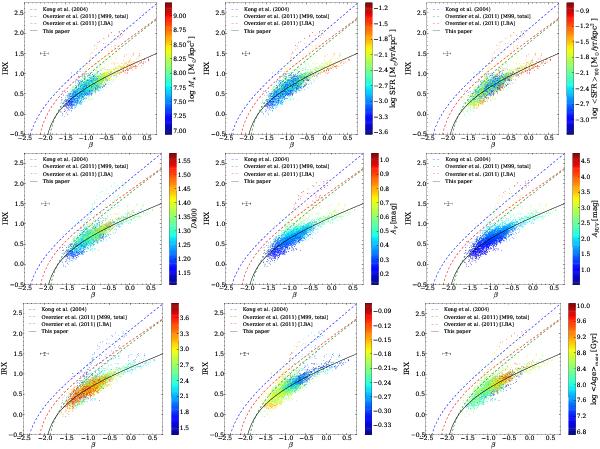
Ratio between the IR (provided by CIGALE) and observed FUV luminosities, IRX (y-axis) versus the UV slope β (x-axis). The colours of the individual points represent the value of the parameter indicated to the right of the colourbar. From the top-left corner to the bottom-right corner the parameters presented here are: log M⋆, log SFR, log ⟨ SFR ⟩ 100 (averaged over 100 Myr), D4000 index, AV, AFUV, α, δ, and log ⟨ Age ⟩ mass. Blue points indicate a low value and red points a high value. The dashed lines represent the IRX-β relations of Kong et al. (2004) in blue, and the Meurer et al. (1999) and Lyman-break analogue relations (green and red) that have been derived by Overzier et al. (2011). The median 1-σ uncertainty is displayed on the left side of each plot. Finally, the solid black line represents the best fit for the entire sample, minus the discarded data points: IRX = log [(100.396(β + 2.046) − 1)/0.373] .
Current usage metrics show cumulative count of Article Views (full-text article views including HTML views, PDF and ePub downloads, according to the available data) and Abstracts Views on Vision4Press platform.
Data correspond to usage on the plateform after 2015. The current usage metrics is available 48-96 hours after online publication and is updated daily on week days.
Initial download of the metrics may take a while.