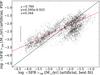
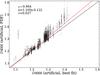
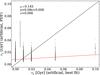
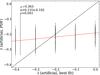
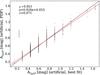
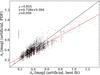
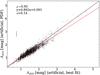
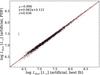
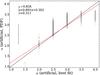
Fig. 4
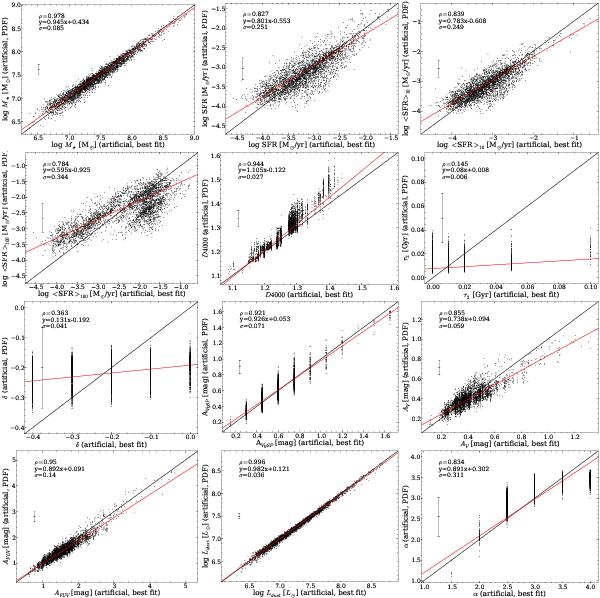
Output parameters of the artificial catalogue for the best fit (x-axis) and the probability distribution function (PDF) analysis (y-axis) after a random error has been injected into the model SED. From the top-left corner to the bottom-right corner the output parameters presented here are: log M⋆, log SFR, log ⟨ SFR ⟩ 10 (averaged over 10 Myr), log ⟨ SFR ⟩ 100 (averaged over 100 Myr), D4000, log τ2, δ, AVySP, AV, AFUV, log Ldust, and α. The Pearson correlation coefficient ρ is indicated in the top-left corner of each plot. For each parameter we have also computed the best linear fit which is shown in red along with the equation in the top-left corner where the standard deviation σ around this best fit is also indicated. These fits take the uncertainties computed by CIGALE on each data point into account. The median error bar computed by CIGALE is shown on the left side of each plot.
Current usage metrics show cumulative count of Article Views (full-text article views including HTML views, PDF and ePub downloads, according to the available data) and Abstracts Views on Vision4Press platform.
Data correspond to usage on the plateform after 2015. The current usage metrics is available 48-96 hours after online publication and is updated daily on week days.
Initial download of the metrics may take a while.