Fig. 3
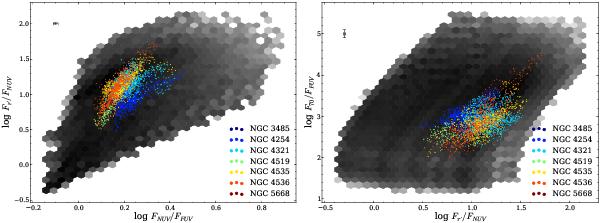
Comparison between the colours of the models (grey hexagons) and the observed colours (circles). For better visibility, the grey shade is proportional to the log of the number of models within a given bin. Black represents a high density of models, and white indicates that there is no model in this bin. The colour of the circles identifies the galaxy they belong to. The left plot compares the NUV − r′ versus the FUV − NUV colours, and the right plot compares the FUV − MIPS 70 versus the NUV − r′ colours. The median 3-σ error bars are displayed in the top-left corner of each plot.
Current usage metrics show cumulative count of Article Views (full-text article views including HTML views, PDF and ePub downloads, according to the available data) and Abstracts Views on Vision4Press platform.
Data correspond to usage on the plateform after 2015. The current usage metrics is available 48-96 hours after online publication and is updated daily on week days.
Initial download of the metrics may take a while.