Fig. 4
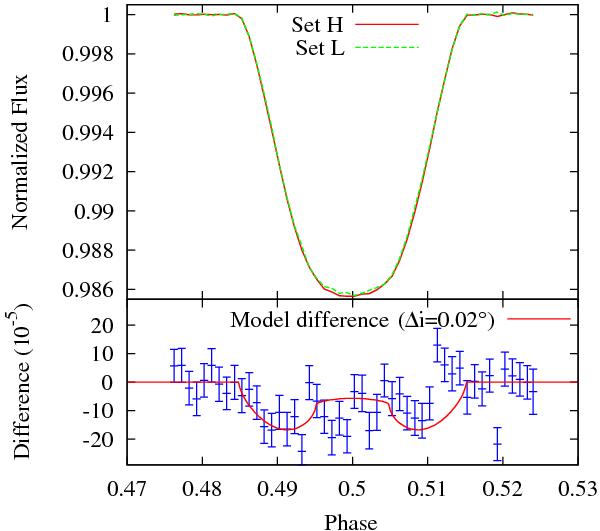
Upper panel: averaged templates of two sets of 10 transits with high (H, solid red) and low (L, dashed green) inclinations, respectively, as expected from the tentative sinusoidal variation of the inclinations obtained by Kepler. Lower panel: the difference between the two averaged transits. The expected difference for two models pertaining to i = 83.97° and 83.99° is shown for reference (solid red).
Current usage metrics show cumulative count of Article Views (full-text article views including HTML views, PDF and ePub downloads, according to the available data) and Abstracts Views on Vision4Press platform.
Data correspond to usage on the plateform after 2015. The current usage metrics is available 48-96 hours after online publication and is updated daily on week days.
Initial download of the metrics may take a while.