Free Access
Fig. 3
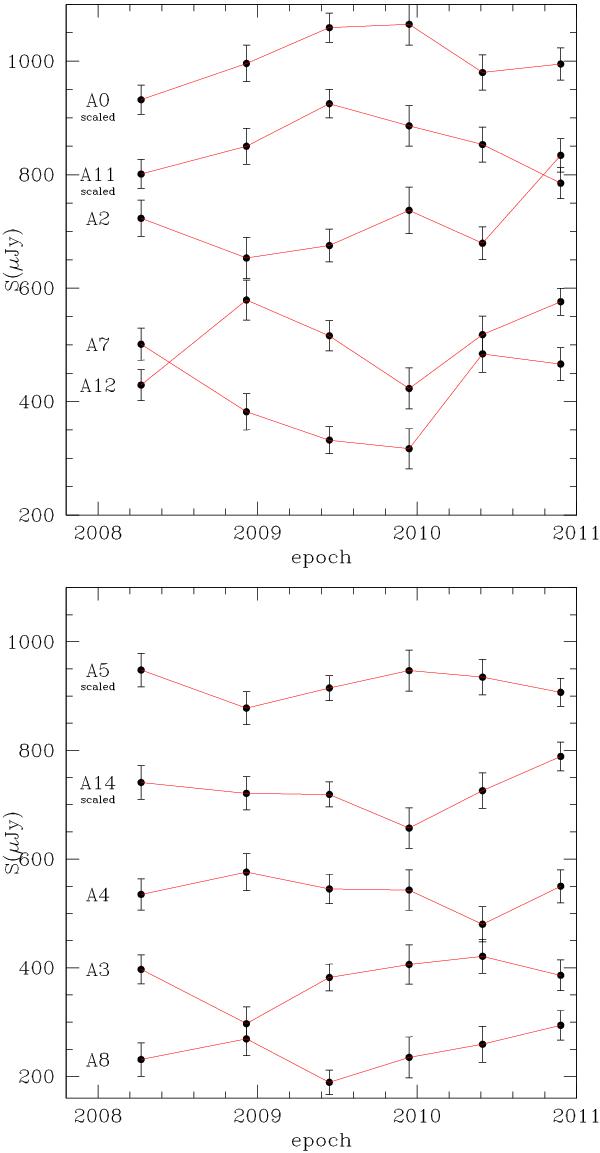
Upper panel: light curves for five sources classified as variable. The data for source A11 and A0 were scaled up by 500 μJy and 600 μJy, respectively, for clarity. Lower panel: light curves for five sources classified as non-variable. The data for A14 and A5 were scaled up by 500 μJy and 700 μJy, respectively, for clarity.
This figure is made of several images, please see below:
Current usage metrics show cumulative count of Article Views (full-text article views including HTML views, PDF and ePub downloads, according to the available data) and Abstracts Views on Vision4Press platform.
Data correspond to usage on the plateform after 2015. The current usage metrics is available 48-96 hours after online publication and is updated daily on week days.
Initial download of the metrics may take a while.