Fig. 2
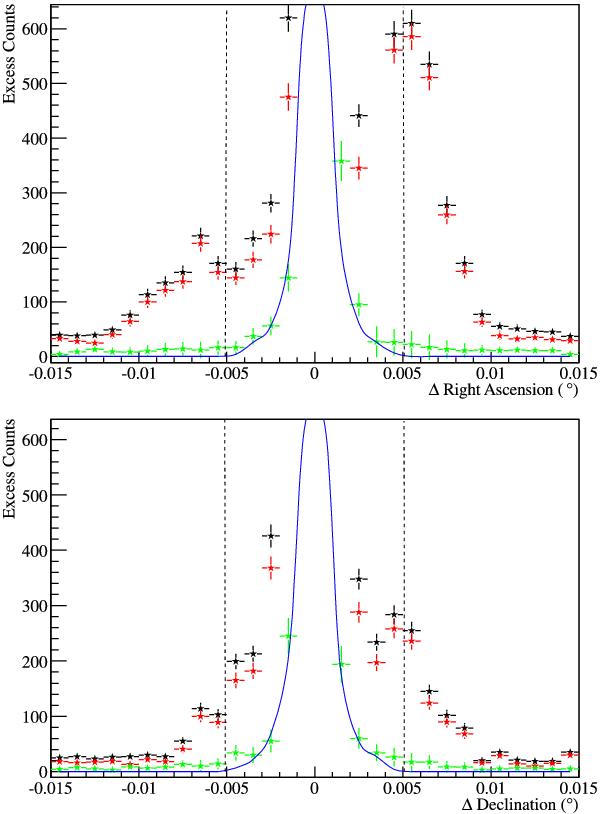
Slices through the Chandra images in right ascension (top panel) and declination (bottom panel) (see text for details). The width of the extraction region was 7′′. Black points represent the profile of the full energy range (0.3−10.0 keV) image. Red points represent the low (<5 keV) energy data and green points represent the high (>5 keV) energy data. The blue curve shows the simulated Chandra-ACIS PSF at the chip-position of η Carinae in this observation. The dashed vertical lines show the size of the excluded region around η Carinae (circular region in Fig. 1). The y-scale has been truncated to highlight the behaviour away from the central peak. Note that the PSF is normalised to the maximum of the full-energy-range data.
Current usage metrics show cumulative count of Article Views (full-text article views including HTML views, PDF and ePub downloads, according to the available data) and Abstracts Views on Vision4Press platform.
Data correspond to usage on the plateform after 2015. The current usage metrics is available 48-96 hours after online publication and is updated daily on week days.
Initial download of the metrics may take a while.