Fig. 4
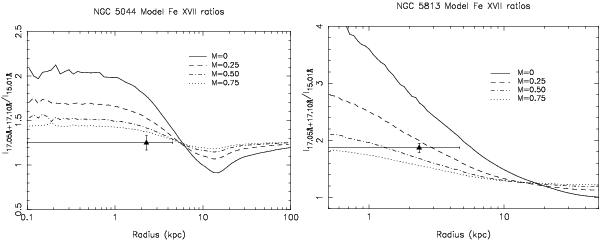
Fe xvii line ratios for NGC 5044 (left) and NGC 5813 (right). The lines give the predicted (I17.05 + I17.10)/I15.01 line ratio for different Mach numbers (0, 0.25, 0.5, and 0.75) from Monte Carlo simulations assuming isotropic turbulence. Note that these profiles have been re-scaled to the optically-thin (I17.05 + I17.10)/I15.01 line ratio from Doron & Behar (2002). The data point in each plot is the measured line ratio derived from RGS.
Current usage metrics show cumulative count of Article Views (full-text article views including HTML views, PDF and ePub downloads, according to the available data) and Abstracts Views on Vision4Press platform.
Data correspond to usage on the plateform after 2015. The current usage metrics is available 48-96 hours after online publication and is updated daily on week days.
Initial download of the metrics may take a while.